By Edmund Kelly
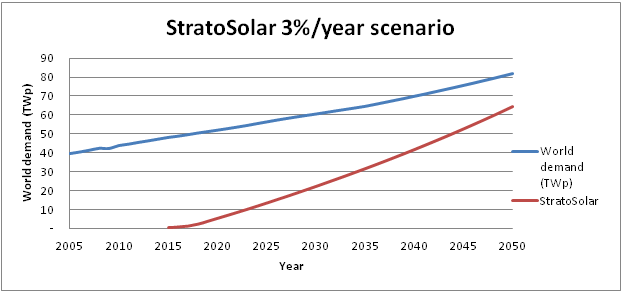
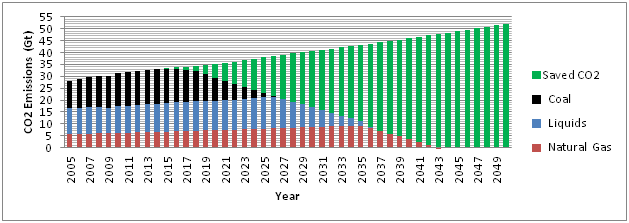
I have produced a short video that introduces StratoSolar as a possible solution to the looming CO2 climate crunch. Awareness of the problem is growing and some action is occurring, particularly in China. However, action on a scale necessary to solve the problem is not occurring, and as the video explains is very unlikely to occur with todayâs technologies or politics. By Edmund Kelly
Comments
A simple question is why can’t ground PV do the same thing as the StratoSolar scenario? The simple answer is it is too expensive and it won’t get cheap enough anytime soon. The sharp drop in PV prices over the last few years have stopped, and there is no rational basis for them to fall further for a long time. A good thing about the recent price drops is it has raised awareness of PV and its potential for further improvement. A bad thing is it has created over optimistic and unrealistic assessments of PV’s chance to be a significant energy provider in the short term.
In the end, energy is all about politics and economics. StratoSolar PV panels have an average utilization of 40%. Ground PV panels have an average utilization of about 13%. Based on a simple analysis, ground PV electricity costs three times as much, and importantly this is significantly more than electricity costs today. That means that it can only be sold with the help of subsidies. As Germany has demonstrated, profitability drives investment. By providing subsidies that guaranteed profitable investment, German private industry jumped at the opportunity and installations grew very rapidly. Japan and China are following Germany’s lead. But things are actually worse than this. Its always tempting measure solar with the best utilization from sunny places, but unfortunately with solar its all about geography. There are very few places with good solar near population centers. Southern California is a rare example. Take Germany as a more representative example. PV utilization in Germany is around 11% from the published data. Germany could do a deal with a sunny location and build HV transmission lines to transport the power. This has numerous problems. On purely money terms, as panels have reduced in cost, and transmission lines have not, its likely that the better PV utilization in the desert will not cover the HV transmission costs. Don’t forget that the transmission lines will have the low PV utilization, which more than doubles the cost compared to conventional HV transmission lines. On top of this are the political constraints. HV transmission lines are not liked, and the countries where the panels and HV transmission lines are placed may not be the most politically stable. Even in the US, politics and economics will favor New York, for example, building in New York rather than dealing with getting power from New Mexico via transmission lines through many states. What this means is that ground PV discriminates, and northern climes get to pay twice as much, or more for electricity. Economics will also dictate that southern climes will get most of the synthetic fuel business. Because of the lower utilization, ground PV electricity will always cost 3X StratoSolar electricity. This factor makes StratoSolar economic for electricity, and then fuels long before ground PV. The learning curve is good but not that good. The learning curve will not continue for ever, and when it slows it will create a permanent cost barrier that ground PV will never overcome. StratoSolar is far less variable with geography, so Germany or New York, for example could provide all their energy needs, both electricity and fuel, locally. So to summarize, ground PV is too far from viability today, and too variable with geography to ever be an easy political choice. StratoSolar is viable today, and does not discriminate against geography. The StratoSolar capital investment for both PV plants and synthetic fuel plants will average a sustainable $0.6T/year, in line with current world energy investment. $2T/year capital investment for ground PV is a lot harder to imagine. By Edmund Kelly The following describes a StratoSolar deployment. The key point this illustrates is the simplicity. This is not an "all of the above strategy" with lots of moving parts and government interventions to subsidize or tax various market participants. The impact on land and existing infrastructure is indirect, and not an impediment to deployment. China in particular could adopt this strategy and replace coal without penalizing GDP growth.
This shows that meeting the 450ppm CO2 goal in a realistic time frame with a realistic cost is feasible. Ground PV is still too expensive and will always be a factor of two to three behind in cost. The political costs and delays of land use and grid upgrades will further limit the scope and time frames of what is achievable. The key enabler is economic viability without subsidy. StratoSolar deployment sequence: Step 1) Deploy StratoSolar initially at $1.50/Wp, $0.06/kWh. This is profitable in most markets and volume growth is not constrained by amount or availability of subsidy. Step 2) After about 25GWp of cumulative production, StratoSolar initial learning curve takes costs down to $1.00/Wp, $0.04/kWh. Step 3) Start deploying electrolysers costing $0.50/W making hydrogen for $3.00/kg. This provides fuel for nighttime and winter electricity generation for $0.08/kWh and starts an electrolyser learning curve that will reduce the $/W electlolyser cost. Step 4) Continue deploying StratoSolar to 1TWP cumulative capacity. Costs reduce to $0.50/Wp, $0.02/kWh. Electrolysers reduce to $0.20/W, Hydrogen reduces to $1.25/kg, nighttime electricity reduces to $0.04/kWh. Step 5) Start liquid fuel synthesis using hydrogen and CO2. Synthetic gasoline costs $3.00/gallon. This starts a learning curve for fuel synthesis plants. Step 6) By the 10TWp cumulative deployment point costs are down to $0.25/Wp, $0.01/kWh, $0.60/kg for Hydrogen, and synthetic gasoline costs $1.00/gallon. This does not discuss time frames. These will depend on time to acceptance. The cumulative TWp needed to replace all world energy demand projected for 2045 is around 80TWp. The two time alligned graphs below illustrate a yearly StratoSolar goal of replacing 3% of world energy demand. Yearly StratoSolar production would need to ramp fairly quickly to 1.5TWp by 2020 and then increase slowly to about 2.5TWp by 2045 to meet increasing world energy demand. 3% is pretty aggressive, but not excessive and aligns with a 30 year plant life. Yearly world investment never exceeds $1T/y, as costs fall with cumulative installed capacity. For reference current world energy is about 8% of GDP, or about $6T/y. The 3%/year replacement scenario shown in the graph replaces about 80% of world energy with StratoSolar by 2050 with the remaining energy coming from the current projections for nuclear, hydro and other renewables. The CO2 emissions reduction chart below shows the CO2 reduction associated with this StratoSolar deployment scenario. We show a simple sequence with coal being replaced first, then oil, and finally gas. The reality would be along these lines but with less distinct transitions. Coal is the obvious first target as the biggest and dirtiest emitter and the easiest to replace with electricity. Oil is next as its high cost make it the easiest to replace with cost competitive synthetic fuels. Natural gas is last because it is the logical partner to solar, it’s the cleanest, and its low cost keeps it cost competitive for longer. The most striking aspect of the graph is the illustration of the scale of CO2 emissions saved. Cumulative CO2 emissions between 2005 and 2043 are 1,800Gt with business as usual versus 820Gt with StratoSolar. By 2043 CO2 emissions could be zero, whereas business as usual is pumping out over 50Gt/year . 820Gt is well within the 450ppm CO2 goal of 1,700Gt. Sources: History: U.S. Energy Information Administration (EIA), International Energy Statistics database (as of March2011), website www.eia.gov/ies; and International Energy Agency, Balances of OECD and NonOECD Statistics (2010),website www.iea.org (subscription site). Projections: EIA, Annual Energy Outlook 2011, DOE/EIA0383(2011) (Washington, DC:May 2011); AEO2011 National Energy Modeling System, run REF2011.D020911A, website www.eia.gov/aeo, and World Energy. By Edmund Kelly Thisarticle in Renewables Energy Focus magazine provides more details on the state of the PV market as companies report their earnings. SPV Market Research puts the PV panel market in 2012 at 25GWp and $20B. Panel maker losses exceed $4B. This comes as Suntech the number six PV panel manufacturer declares bankruptcy.
2013 is not shaping up as much better than 2012. Major shifts in regional demand are underway, driven by where the subsidies are growing or declining. European demand is shrinking with reduced subsidy, but China has a profitable FIT and a goal of 10GW, and the generous FIT in Japan is projected to see 6GW installed. The Japanese growth will be met by Japanese panel makers despite their lack of market competitiveness, which may not help the PV business generally. Current panel prices combined with subsidies are also driving growth in the US(primarily California), which may see 5GW installed in 2013. The story is the same everywhere. Subsidies drive the market, and their amount determines the market size. The overall PV market is not likely to grow significantly in 2013 over 2012. As prices stabilize, and even rise a bit to restore profitability, the historical learning curve of PV panel price versus cumulative volume is still holding up very well. This is important to understand as it establishes the realistic fundamentals that should drive expectations for what can be achieved by PV. There has been a tendency to take an optimistic view of PV competitiveness based on extrapolating short term trends, or localized successes (like Germany) driven by large subsidies. PV has made great strides, but is still only competitive with a large subsidy in normal geography, or with a smaller subsidy in a sunny geography like California. The historical learning curve will take many years of current production rates to get PV panel prices down to competitive levels. To put things in perspective, PV on a world average has less than a 15% utilization. StratoSolar is 40% utilization on average. For ground PV panels to match StratoSolar, prices will have to more than halve from current levels to about $0.30/Watt. This will take a long time, perhaps decades. Itâs a catch 22 for ground PV. Prices will only fall with volume, but volume will only happen with lower prices. StratoSolar competitive energy pricing has the potential to fundamentally change the energy market by driving PV volume installation now. By Edmund Kelly Analysis of the PV market in 2012 have continued to roll in. They vary considerably in their estimates of PV capacity installed, several estimating capacity installed exceeded 30GWp. A recent report from NPD Solarbuzz was less optimistic. According to the market research firm, PV demand in 2012 reached 29GW, up only 5% from 27.7 GW in 2011. Notably, the growth figure is the lowest and the first time in a decade that year-over-year market growth was below 10%..âDuring most of 2012, and also at the start of 2013, many in the PV industry were hoping that final PV demand figures for 2012 would exceed the 30GW level,â explained Michael Barker, Senior Analyst at NPD Solarbuzz..âEstimates during 2012 often exceeded 35GW as PV companies looked for positive signs that the supply/demand imbalance was being corrected and profit levels would be restored quickly. Ultimately, PV demand during 2012 fell well short of the 30GW mark.â As usual, the industry and analyst projections going forward are for things to improve dramatically. A more sober analysis would say that the market will continue its painful restructuring with slow to modest growth. The analyses tend to focus on GW installed but a look at the dollar numbers is more revealing of the state of the industry and its likely future. This graph shows a simple analysis of relevant dollar numbers rather than GW installed numbers for 2010, 2011,2012 and an estimate for 2013 based on a forecast of an increase of 20% in GW installed, which may be optimistic.
The Total line shows the total world dollars spent on PV systems, which includes PV panels and Bulk of Systems (BOS). This line has been relatively constant at between $50B and $60B. Over this timeframe the combined reduction in panel and BOS costs has offset the decline in subsidy. The panel line shows that revenue to PV panel makers has been declining significantly. The increase in GW has not offset the fall in PV panel prices, and the revenue decline will continue in 2013. As is known the PV panel business has a capacity to produce about 60GW/year, but demand is about 30GW/year. This has led to severe industry restructuring and low panel prices that in many cases are below the cost of production. There is no new investment in capacity, so the current panel prices are unlikely to fall significantly if most manufacturers are already losing money. The subsidy line shows an estimate of the amount of total world subsidy. This, as is well known has been declining, but the decline has been dramatic. Germany alone pumped in over $100B over 2009-2011, but is now well below $10B/year. China has stepped in energetically, and there is support in Japan and the US, but it still only adds up to half of what Europe used to support, and the overall subsidy amount continues to decline. The PV business is still driven by subsidies. They have declined from about 60% to about 40% of the business, but are still necessary, as current PV systems do not make electricity at competitive costs despite the dramatic PV panel price decline. The overall net effect of panel price declines and subsidy declines has been a market with fairly constant overall revenue. If worldwide subsidies increased that would drive growth which would use up the excess panel manufacturing capacity which would lead to profit and investment in new more efficient capacity and panel price declines that would reduce the need for subsidy. If subsidies continue to decrease, there is little room for PV-panel prices to decline further, and so the overall business will shrink. None of this is coordinated at a world level, so it could go either way. The prospects for increased subsidies overall worldwide seems low, given the current economic focus on austerity in Europe and the US. This has been a long article to get to the simple conclusion that the PV business is unlikely to grow dramatically in the near future and current PV panel prices are likely to prevail for at least several years. Also, optimistic projections for PV panel price reductions based on projecting the recent dramatic drop forward are not realistic, and estimates based on the historical long term trend are likely to prove more accurate. PV at around 30GW/year installation is a tiny fraction of world electricity generation (5000TW), never mind world total energy. The only way to get a dramatic growth in PV is to either get PV to produce electricity at a cost that generates sufficient profit to attract private investment, or massively increase world subsidies. StratoSolar offers the profitable investment path. Our current design if deployed today with current PV cells would generate electricity for $0.06/kWh with very conservative platform cost estimating. This is profitable without subsidy in almost all markets. By Edmund Kelly Now that 2012 is behind us it is useful to see how things have worked out in the PV market during 2012 and how they look going forward.
As my early 2011 blog posts predicted, there was little growth in 2012 over 2011. The overall GW installed in 2012 grew slightly over 2011 (from 27GW to about 29GW), largely because Germany installed 7.5GW, as opposed to their 3.5GW goal. The overall dollar size of the PV panel market shrank by about 50% as industry consolidation drove panel prices down to around $0.70/Wp and installed utility projects to about $2.40/Wp in the US. Projections going forward are for about a 20% annual increase in installed capacity. Panel prices will stabilize somewhere between $0.70 and $1.00 as the shakeout continues into 2013 and then slowly decline from there in future years as the installed capacity grows. This leaves prices still too high to compete without subsidies even in the best sunny locations. This means the market size is still determined by the amount of subsidy, which with reducing subsidies explains the modest growth projections (China and Japan are exceptions). PV has yet to become a significant % of the grid in any geography, so as yet additional costs for backup and transmission are not being counted. This will change going forward and act as a further brake on possible PV growth. Green advocates like Greenpeace need to become more realistic in their assessments. Current wind and solar will not make a significant impression on CO2 reduction before 2035 and currently could easily be adding to CO2 rather than reducing it. The impact is so small as not to be measurable in the current atmospheric CO2 levels. Unrealistic optimistic wishful thinking are damaging the prospects for any meaningful policy to reduce CO2. NREL and other researchers bring out studies that purport to show that the world could adapt to run on mostly wind and solar, but donât spell out the costs. More importantly in a world where the US is a decreasing influence on energy and everyone has to act together, what the US does alone is increasingly irrelevant. As I keep repeating, a PV solution that enables todayâs PV cells to produce cost competitive electricity without any subsidy, eliminates reliability and backup costs and long transmission lines, and does this for all geographies including cloudy and/or northern locations deserves some consideration. By Edmund Kelly Another common sense book about sustainable energy is Sustainable Energy - without the hot air by David MacKay. Dr MacKay writes from a UK perspective about the various sustainable energy alternatives for the UK and their potential impact. He does not take a position on what solutions to pick but tries to get across the scale of solutions that could work for the whole country. He tries to avoid politics and policy and only lightly touches on economics.
I took one of his scenarios (scenario M) shown on a map of the UK and did a comparison of an equivalent StratoSolar solution. The UK, like Japan is very densely populated and most sustainable energy solutions take up more room than is available, even if it were politically acceptable to do so. By Edmund Kelly The last post was about boom and bust in US shale gas, and previous posts have been about boom and bust in the PV industry. Both busts are similar in dollar terms and are occurring simultaneously, with many billions of investment mis-allocated. Both are also similar in the confusion and mis-information they engender.
Previous posts have covered the overcapacity and restructuring of the PV business in general terms. The long and growing list of specific bankruptcies and larger firms withdrawing from the market reinforces the grim reality of the situation. However, there continues to be regular articles and posts that ignore the underlying market realities and interpret continually falling panel prices as a sign of industry viability rather than industry decline. Some even go so far as to project the last few years of dramatic price decline forward and anticipate lower prices and a golden age for solar deployment. A telling statistic for projecting future PV manufacturing capacity growth is the purchasing of capital equipment needed to build PV plants. These articles cover the 80% decline in the solar equipment supply business and the bankruptcies and layoffs. As existing capacity is being destroyed through retrenchment and bankruptcy and no new capacity is being built, eventually supply will balance demand and the surviving manufacturers currently selling at or below cost will raise prices to become economically viable. The historic long term learning curve of 20% reduction in PV panel prices with each doubling of cumulative capacity still seems to be the best price predictor, as it has been for over thirty years. This would predict current PV panel prices of around $1.00/Wp which seems a likely point for prices to stabilize maybe next year (2013). Given the cyclic boom and bust nature of the business prices may not decline from $1/Wp for several years. This does not foretell a golden age of PV growth as prices at this level still need substantial subsidies to be market competitive. The amount of subsidy determines market size. Subsidy is in general decline. There is no driver for market growth other than fickle and limited government support. By Edmund Kelly GTM research has published a report that puts 2012 PV panel manufacturing capacity at near 60GWp and demand at 30GWp. The forecast is for 21GWp of capacity to be closed over the next few years. Based on the retrenchments in Europe especially in Germany and Italy its hard to see a 2012 demand of 30GWp without very optimistic forecasts for other markets like China, Japan India and the US, so things are probably worse than these forecasts.
The report does forecast that low cost Chinese producers will be able to manufacture panels at below $0.50/Wp by 2015, and with supply in balance with demand these should sell for less than $1.00/Wp. This lines up with my previous blog posts. Business as usual will not see PV contributing much to overall energy demand for a long time. Maybe its time to think about investing in possibilities that could succeed? US clean energy subsidies declining from $44B in 2009 to $16B in 2012 and probably $11B by 2014.5/14/2012 This New York Times article outlines the decline and credits the Brookings Institution, The World resources foundation, and The Breakthrough Institute. They jointly authored the following report “Beyond Boom and Bust” that details the decline and policy changes that they argue would make for a more sustainable subsidy regime. Unfortunately the current political situation does not bode well for reform, particularly if it costs money.
The current subsidy regime is boom and bust and not focused on technology improvement. It is classic government subsidies that encourage the status quo and create a class of companies that live on the subsidies without incentive to improve and who lobby to maintain the subsidies regardless of the benefit or lack thereof. It also funnels money to favored constituencies like government contractors and peer reviewed scientists. The main focus should be on technologies that have a realistic chance of economic viability with an honest accounting of costs associated with intermittency and geographic isolation. Too much of alternative energy is over optimism and pass the buck accounting. |
Ed Kelly
President of StratoSolar Archives
December 2023
Categories
All
|