
World primary energy in 2050, 33TWy. based on EIA baseline projection
World Energy 2050 Sankey from Excel
This Sankey diagram shows current projections of where energy comes from and how it is used by the major segments of the world economy in 2050. EIA baseline projections for primary world energy consumption projected to 2050 in units of Terra Watt years(TWy) (shown below) provide the inputs on the left.
The EIA accounts for the primary energy from Nuclear, Hydro, Wind, Solar and Bio by calculating an equivalent amount of fossil fuel generation needed to replace them. This means that the primary energy attributed to these sources is three times the electricity energy they generate. In this diagram we show nuclear and other electricity generation directly to avoid the confusing effect that the large artificial rejected energy from Nuclear, Hydro, Wind, Solar and Bio would add to the diagram.
The estimates for how the energy is divided between the sectors is based on current world usage matched with the increased fraction of electricity generation from non CO2 emitting sources. This aligns with the general growth trend for electricity consumption relative to consumption from other sources of energy.
If you hover the mouse over an energy flow, the magnitude of the flow will appear. So for example, the generation to distribution flow shows 3.4 TWy. We know that the average overall electricity generation capacity factor is close to 50% for most large markets like the US or Europe or the world as a whole. So this implies that the fossil fuel driven world electricity generation nameplate capacity in 2050 will be about 6.8 TW.
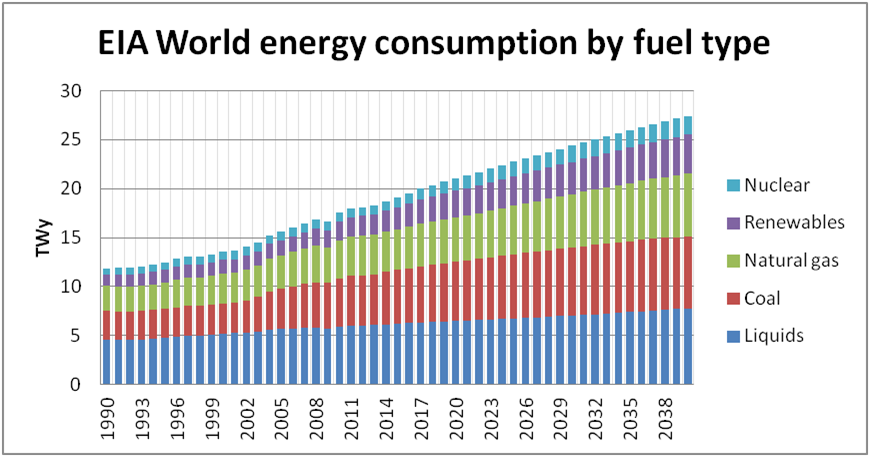
EIA projection of world energy growth in consumption by fuel type with historical data up to 2013.
DOE/EIA-0484(2012)