
This recent article in the New York times provides a visual representation of electricity generation by source of energy from 2000 to 2022 for all countries. The article is based on data from Ember.
The data shows that world electricity generation has about doubled over this period from 15,000 TWh to 30,000TWh. Generation in the US and Europe has been almost constant during this 22 year period, though the energy sources have shifted away from coal to mostly gas and some renewables. World growth has been from China and other developing economies. China went from 1,200 TWH in 2000 to 8,500 TWh in 2022, about one third of world electricity generation, while the US, Europe and the developed world electricity consumption hardly grew at all. Some of the stability in the developed world was due to the transfer of much energy intensive manufacturing to China.
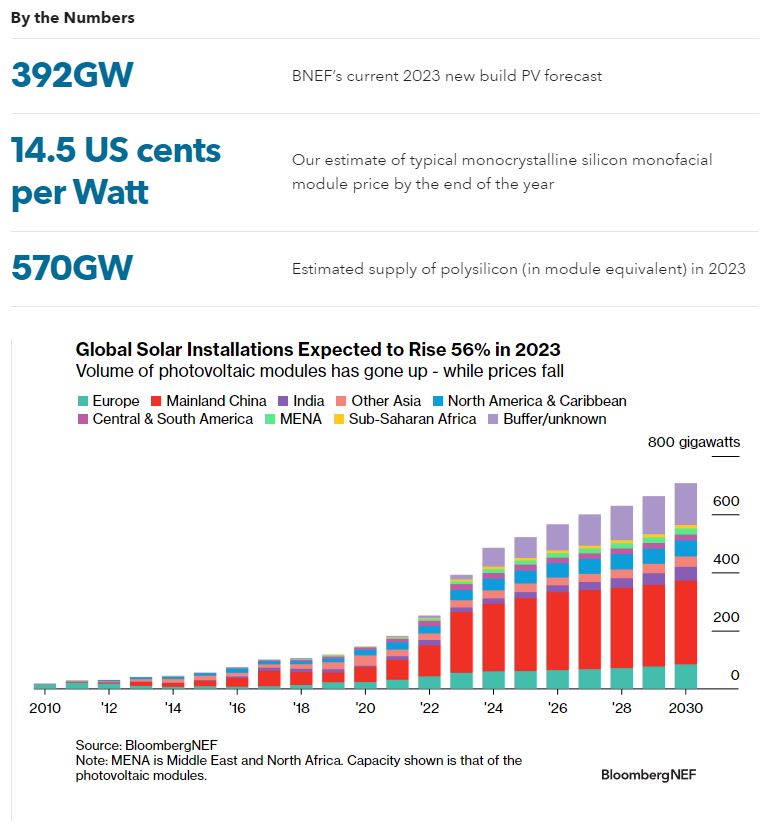
China added 210 GW of new solar PV in 2023 which sounds like a lot but relative to China’s total generation capacity of over 2 TW wind and solar are only about 12% of generation. China has problems with coordinating its provision of electricity transmission and distribution for intermittent sources but is still far short of the 25% or so limit for fossil fuel backed solar and wind generation.
No major electricity system has yet to get to this scale, where energy storage becomes a requirement for additional growth. Storage so far is used to stabilize grids from the rapid fluctuations introduced by intermittent renewable sources as with the California “duck curve”.
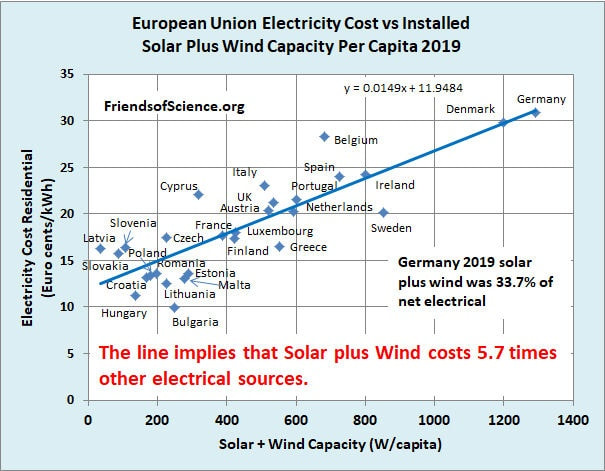
The recent COP28 and previous political agreements clearly demonstrate that the central issue with energy is economics. Activists like to claim that renewables are economically viable but the sad fact is that even with cheap PV panels and windmills, intermittent renewables already significantly increase electricity prices to consumers and prices will only continue to increase at a faster rate as necessary storage and grid upgrades are added.
Stratosolar offers a path to solar electricity at one fifth to one tenth the price of ground solar at a scale necessary to eliminate fossil fuels. It could be deployed rapidly at scale in time to mitigate the effects of increasing CO2 from fossil fuels. Its low cost enables replacement of ALL fossil fuel use, not just current electricity generation.
By Edmund Kelly
The data shows that world electricity generation has about doubled over this period from 15,000 TWh to 30,000TWh. Generation in the US and Europe has been almost constant during this 22 year period, though the energy sources have shifted away from coal to mostly gas and some renewables. World growth has been from China and other developing economies. China went from 1,200 TWH in 2000 to 8,500 TWh in 2022, about one third of world electricity generation, while the US, Europe and the developed world electricity consumption hardly grew at all. Some of the stability in the developed world was due to the transfer of much energy intensive manufacturing to China.
China added 210 GW of new solar PV in 2023 which sounds like a lot but relative to China’s total generation capacity of over 2 TW wind and solar are only about 12% of generation. China has problems with coordinating its provision of electricity transmission and distribution for intermittent sources but is still far short of the 25% or so limit for fossil fuel backed solar and wind generation.
No major electricity system has yet to get to this scale, where energy storage becomes a requirement for additional growth. Storage so far is used to stabilize grids from the rapid fluctuations introduced by intermittent renewable sources as with the California “duck curve”.
The recent COP28 and previous political agreements clearly demonstrate that the central issue with energy is economics. Activists like to claim that renewables are economically viable but the sad fact is that even with cheap PV panels and windmills, intermittent renewables already significantly increase electricity prices to consumers and prices will only continue to increase at a faster rate as necessary storage and grid upgrades are added.
Stratosolar offers a path to solar electricity at one fifth to one tenth the price of ground solar at a scale necessary to eliminate fossil fuels. It could be deployed rapidly at scale in time to mitigate the effects of increasing CO2 from fossil fuels. Its low cost enables replacement of ALL fossil fuel use, not just current electricity generation.
By Edmund Kelly

 RSS Feed