
|
The StratoSolar concept is usually greeted with a high degree of skepticism. The obvious way to answer this skepticism is to build it and demonstrate that the system works reliably and delivers low cost electricity. This creates a catch 22 situation: It is necessary to raise money to demonstrate viability. However, without a demonstration of viability it is impossible to raise money.
Independent investors like venture capital or private equity are unable and unwilling to quantify the risks of something that appears so different. Despite the view that venture capital invests in risky things, the reality is that they are mostly herd followers, and won't touch anything that has un-quantified risk. The financing problem is further compounded by the fact that there are no general energy companies that have R&D budgets to fund energy as a general category. The energy field is isolated factions, each only concerned with their own business and wary of competition. Oil and gas, coal, nuclear, wind, solar and bio-fuel are separate islands. They raise capital individually and spend it exclusively on their sector. Oil and gas have the most money to invest, but they see exploration as their R&D and other sectors as competitors. In theory, government should see a big energy picture, but in practice democratic governments treat energy as multiple separate political constituencies and funds flow separately to each sector. The only government funded sector that treats energy somewhat broadly is research, so peer reviewed science projects get some relatively small R&D funding. This funding flows through pretty rigid highly regulated channels within academia and the national labs. The current US system provides no funding channel for possible new power system level entrants. Compounding this difficult funding landscape is the polarization of public opinion. People are drawn into camps. Environmentalists see current wind, solar and bio-fuels as the solution and any new contender as a devious plot to undermine their support and delay or stop dealing with the climate problem. Those who think wind and solar are impractical and favor nuclear only want nuclear. Those who don't accept climate change or don't want the government involved favor burning fossil fuels. This polarization of society is reflected in possible investors, most of whom fall into one of these polarized camps. This makes it hard for anything new to get consideration. In pursuing investment we have gradually evolved an approach that uses engineering ingenuity to reduce the cost of the first step that proves viability. This is in the hope that a smaller investment enlarges the potential initial investor pool. This is based on the expectation that seeing is believing and that crossing the divide to a minimal functioning system will give confidence to larger high risk investors attracted by potential for very large profit. Our other approach is to try and provide data and insight, mostly via the web site and blog, that can help reduce the general impression of science fiction by explaining the concept in more detail and with more context. This unfortunately only works for those willing to make a significant effort, and is a pretty hard sell. Overall raising money for this venture has proven to be a far more complex problem than the actual technical design. By Edmund Kelly
Comments
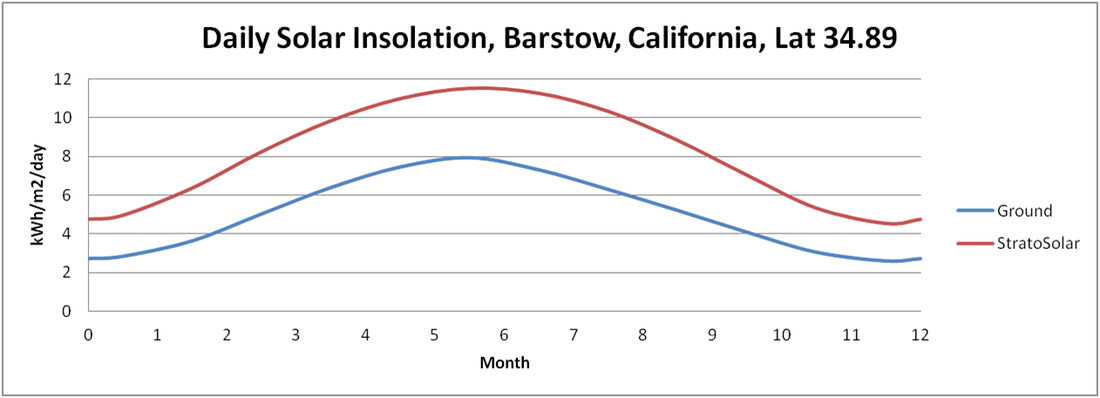
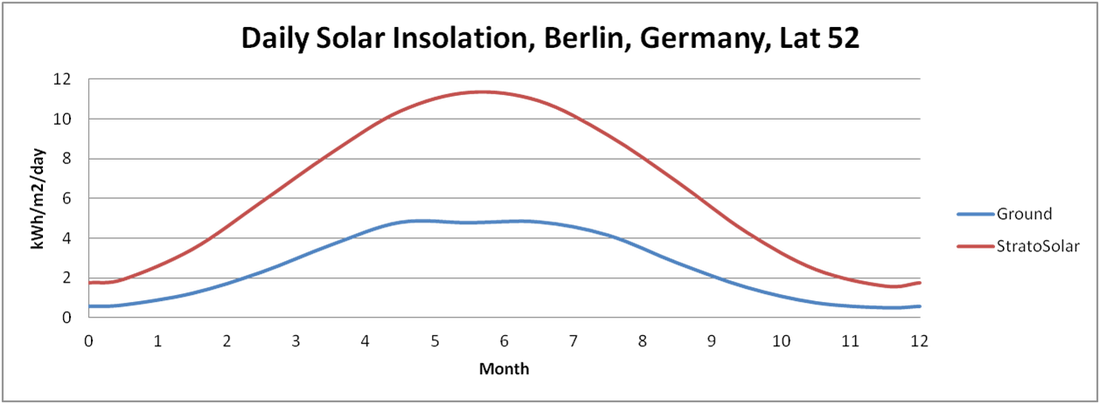
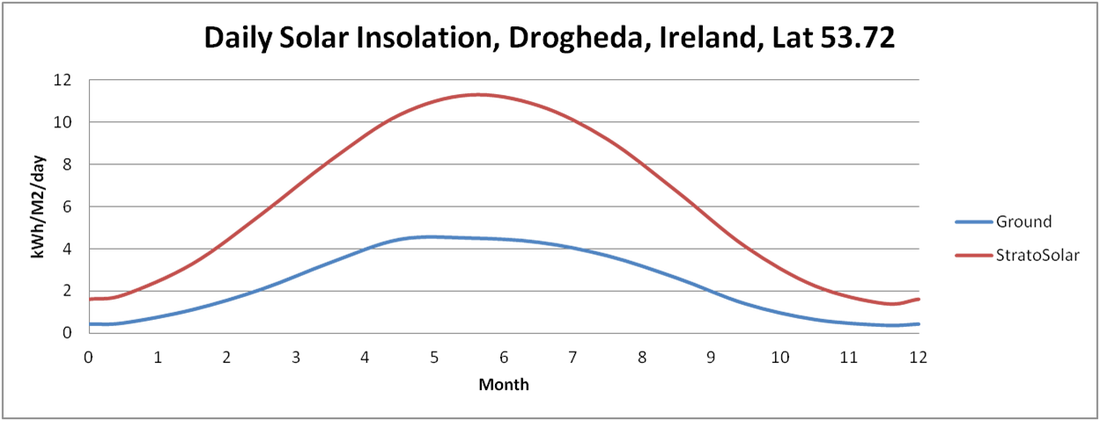
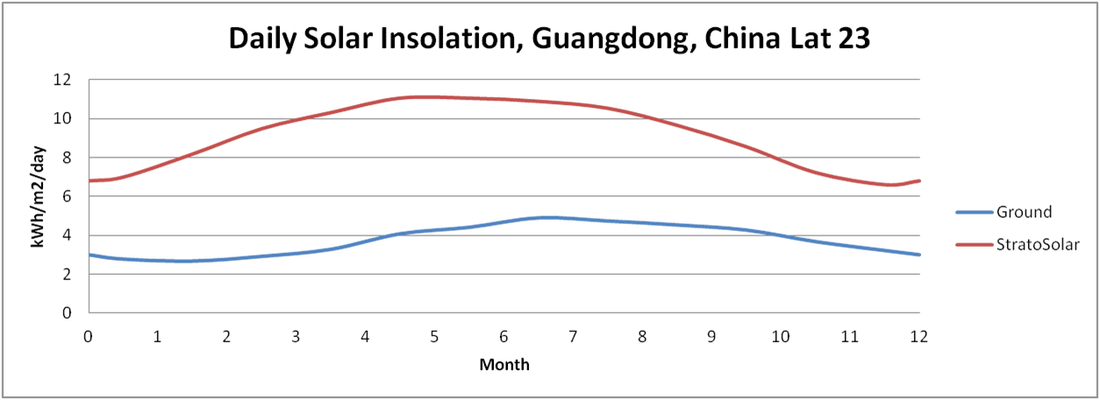
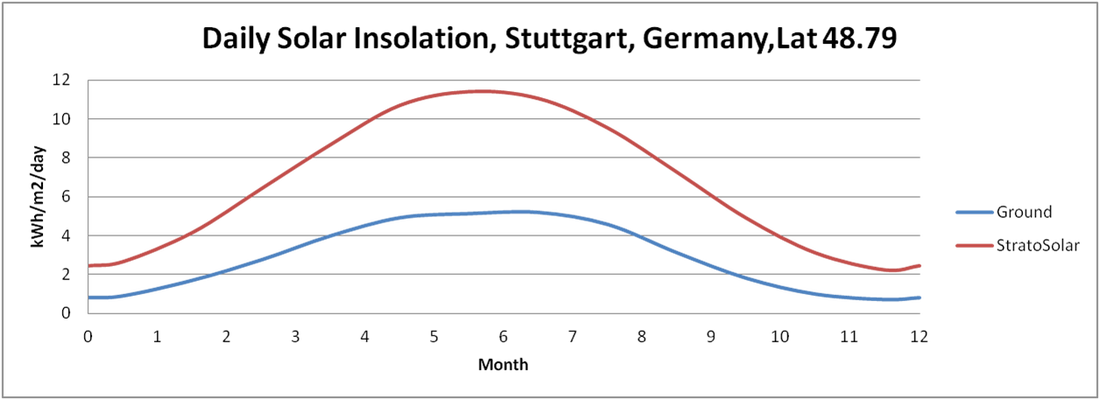
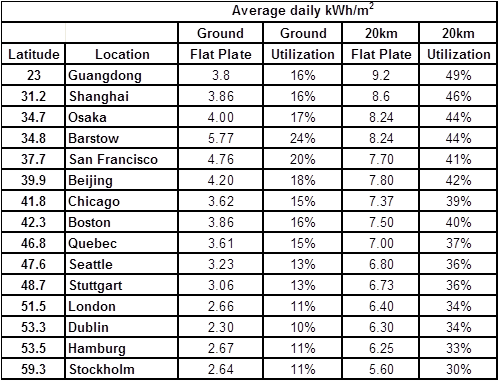
All approaches to eliminating CO2 emissions rely on a transition to a predominately electricity based energy system. We have EIA projections for energy demand in 2050, so it is possible to model different fossil fuel free energy systems that meet this energy demand. This is not an attempt to predict how the future will unfold, but by showing all the pieces and their relationships it helps in understanding the impact of various technologies on the overall system. Today there is no significant electricity storage, and fuel synthesis from electricity is equally insignificant. The need to handle intermittent energy sources, and the need to provide liquid fuel for transportation mean that both technologies are necessary at significant scale by 2050 if fossil fuels are to be replaced. The relative cost of energy from each and the sector energy efficiency and demand for either fuel or electricity will determine the relative size of storage and synthesis. The range of possible outcomes is large and dependent on too many variables to predict. We only show centralized large scale storage but distributed storage at the destination, like batteries in transportation, residential or commercial sectors will also affect the balance of demand between fuel and electricity. Fuel synthesis and electricity storage only exist today as small research prototype systems. Alternative energy is too expensive, and synthesis and storage add considerable expense on top of the cost of energy they take in, so there is no economic incentive to invest in either. The fundamental enabler for storage and synthesis is cheap electricity. Today we make electricity from fossil fuel. An electricity economy inverts this and makes synthetic fuel from electricity. If the synthetic fuel has to compete with fossil fuel, it needs to be cheaper. This means electricity has to be very cheap. Today's $4.00/gal gasoline is $0.10/kWh. The cost of electricity plus the cost of paying for the synthesis plant have to at least match this. If StratoSolar electricity costs $0.06/kWh initially, that leaves $0.04/kWh to pay for synthesis and conversion energy losses. That's about $0.80/Wp capital cost. That capital cost is a stretch for mature fuel synthesis but is not possible with today's technology. Investing in these technologies at the scale necessary for the decade or so needed will only happen when it is clear that electricity is cheap and will get cheaper. So the clean energy cost target is not competing with today's electricity, but being considerably cheaper. Wind and solar are about a factor of two too expensive to compete with electricity in favorable markets today. That makes them four to six times too expensive to compete with fossil fuels using synthetic fuels. Sankey diagrams are very useful for visualizing energy systems. They simultaneously show the elements of a system and their interconnectedness, along with a quantative representation of the magnitudes of the elements and the energy flows between them. Here are sankey diagrams for two possible StratoSolar driven energy scenarios that satisfy the projected energy demand in 2050. The first scenario assumes that the sectors consume fuel and energy like they do today. The second scenario assumes that sectors adjust to consume more of the considerably cheaper electricity, and their efficiency improve because of this. By Edmund Kelly 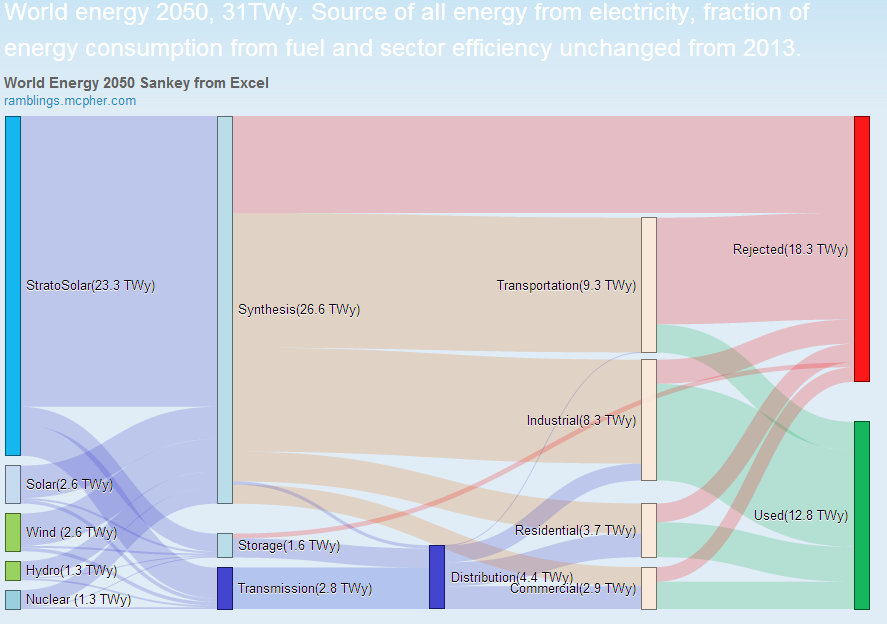 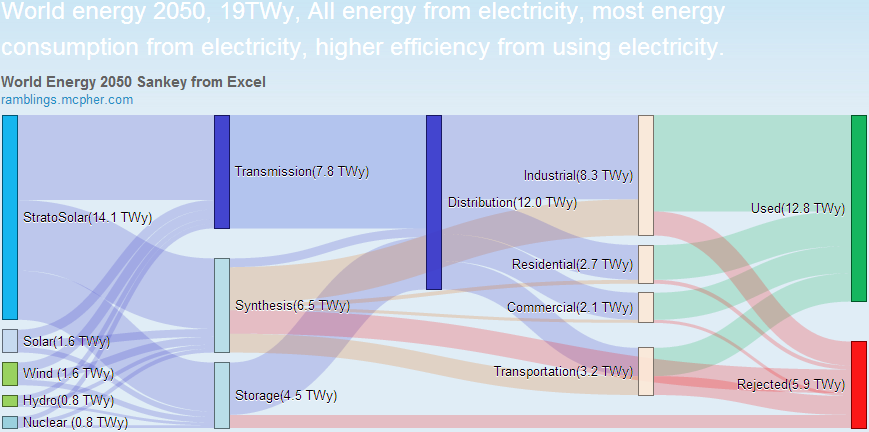 I have updated the web site main page to show graphs illustrating the extra solar energy available at 20km altitude. The visual comparison seems to be more compelling and revealing than simply quoting numbers. NASA has provided a convenient SSE database covering daily ground level solar insolation for the entire planet based on satellite data gathered over 20 years. Using this data and a model for solar insolation at 20km we show comparisons for significant urban locations at latitudes from 23 to 60 north. StratoSolar insolation is just a little less than top of atmosphere insolation which is widely available data, (including in SSE) and a convenient check on the StratoSolar estimates. A perusal of these charts shows how large and consistent the benefit of StratoSolar is. Desert level insolation is commonly used to optimistically represent solar, but the combination of a desert and a large urban area is rare, and the cost of long distance transmission offsets any benefit. California does not appreciate how lucky it is in this respect. North Africa, the Middle East and Australia are about it. An optimistic world average for ground PV utilization is 15%. The chart accompanying the graphs condenses the visual solar insolation into numbers and also provides the equivalent utilizations which are useful for estimating actual power from a given PV nameplate power. By Edmund Kelly Click for larger image
|
Archives
December 2023
Categories
All
|


 RSS Feed
|
© 2024 StratoSolar Inc. All rights reserved.
|
Contact Us
|