|
The last post was about the steady and continuous decline in economic growth rate since 1960. This postulated that the decline in growth rate was due to the growing service sector not adding any growth rate. This post tries to explore and explain why many of the service sectors are non productive.
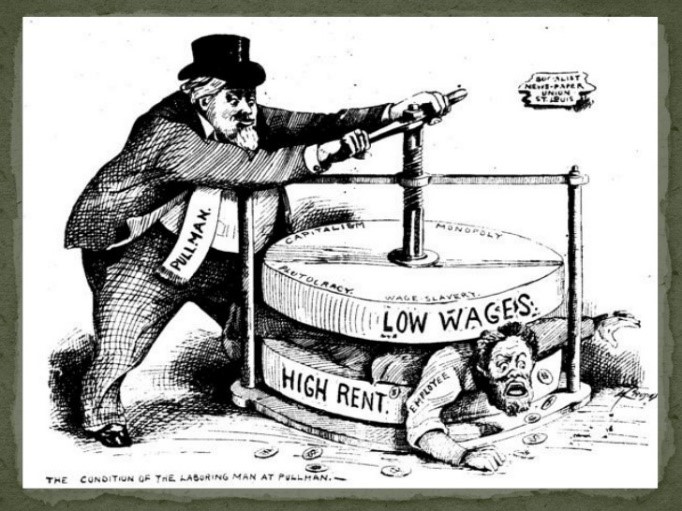
The title is not a spelling error, but a play on “gilded age” a term recently resurrected from the past by the current debate on income inequality. The original gilded age was around the late 1800’s. It was a time of monopoly power accumulated by the new captains of industry during the industrial revolution, particularly in railways, steel and oil. This accumulation of power was a result of natural unconstrained laissez faire market economics. The eventual political response (after much turmoil over decades) was to enforce free markets with government anti-trust regulation to break up the monopolies and outlaw anti-competitive practices. Free markets and democracy are the two bedrocks of our modern society. Contrary to common perception, as this history demonstrates, markets are only free if they are effectively regulated. Normal unconstrained human behavior will tend to monopoly control of markets, not free markets. Since world war two the US economy has evolved from a largely goods producing economy to a largely service based economy. The rules and regulations established to end the gilded age apply largely to the goods producing part of the economy. Service industries do not fit the model of goods producing industries and have evolved effective methods to evade the anti-competitive constraints imposed on goods producing industries. During the middle ages, anti-competitive guilds evolved in northern Europe to control and develop merchant traffic and craft based industry. These guilds came to dominate the commerce of the period. The merchant guilds established geographically distributed networks of trust which ultimately led to finance and banking. The benefit of craft guilds was education and quality control through a standard training system. Guilds acted to ensure the benefit of their members by limiting supply and thus increasing the income of their members. This was an effective monopoly of trade and the skilled labor supply that economists now call “rent seeking”. The growth of income inequality in recent decades has been referred to as a new gilded age. A better moniker would be “a new guilded age”. Many service industries have become effective guilds that benefit their members in much the same “rent seeking” way that medieval guilds benefitted their members. Guilds enrich their members through “rent seeking”. As such they differ from industrial goods based monopolies that primarily enrich their owners, not their workers. Guilds should also not be confused with unions. Unions are organized labor that grew to defend worker’s rights during the industrial revolution. Some unions particularly craft unions still have attributes of guilds, such as apprenticeship, but most unions lack the power of guilds because they do not control the supply of labor. However, the guild analogy is apt for the case of some service sector unions. The US economy has some classical guilds. One of the more obvious and powerful is doctors and medical professionals where the AMA through various means controls the supply of doctors. Other guilds are in film and TV, newspapers, real estate and law. These are a relatively small part of the economy and employment. However, the modern economy has evolved other less obvious, much more powerful, guild like groups that control the majority of the service sector. Examples of guild like groups are corporate officers and board members, banking and financial services, education services and public service unions for police and firemen. The new guild like groups all have infiltrated the regulators meant to regulate or pay them. The regulated have become the regulators. Corporate governance: Boards of directors and company officers make a common distributed guild that mediate their behavior with each other and government through the lawyers and accountants they all employ. This self serving group have enriched their members at the expense of shareholders and employees by peddling false narratives. In theory, boards of directors are meant to act on behalf of shareholders, but lax government oversight has led to the regulated seizing control of the boards that are meant to be the regulator. The most obvious evidence is the many CEOs that are also chairmen of the board of directors. The governance of public companies seems completely broken with average executive pay over 20 times what it was in 1960 and hundreds of times that of average workers. Finance: The financial system as a whole acts as a guild. The key problem is well explained by this paper by Margaret Blair. Banks are incentivized to maximize leverage, which maximizes profit at the cost of increased risk. Regulators should seek to limit leverage which can seriously damage the economy. The false meme that regulation stifles free markets was used by bankers to relax regulations meant to control leverage that were introduced during the great depression. This was aided by the bankers taking control of the government regulators using the argument that banking is so complex, only bankers can understand it. They also corrupted the private ratings agencies that were meant to act as part of the regulatory system. Finance became adept at increasing leverage with new complex financial instruments that expanded debt and hid it from public scrutiny. Income to the guild members was maximized by high-risk, excessive leverage with no personal risk from a “too big to fail” government guarantee. Unfortunately, as well as enriching bankers, the increased leverage has seriously damaged the economy and still poses a huge danger. It raised debt from 150% of GDP in 1980 to 350% of GDP in 2008. This oversupply of debt was mostly used to buy assets, inflating their value and leading to more lending to finance the higher value. Many of these assets were real estate. As a consequence, rents have also inflated as a rent is mostly a mortgage payment and consumer mortgages are effectively rents. Paying these interest “rents” takes 25% of GDP. This is classic “rent seeking” and the main source of the recent growth in income inequality. Debt at these levels is historically unstable as explained by Ray Dalio. The bubble bursting in 2008 was advertised as deleveraging event that was reducing excessive debt. However, the financial sector has proved adept at defending its privileges. Debt, after a small decline is growing again. Its back to about 340% of GDP in 2015. The great recession has not fixed the economy and more turmoil lies ahead until we actually deleverage. Healthcare: US healthcare costs twice as much as European countries but health metrics like infant mortality, and overall mortality are significantly worse. Healthcare in the US has evolved into a complex system that operates for the benefit of providers and not consumers. This is a definition of a guild. Insurance provided by employers separates buyers from sellers, hiding costs. The system is “fee for service” which incentivizes providing excess services and makes no one accountable. Insurance is incentivized by overall rising costs, as their income is a fixed fraction of costs. There is no constraint on cost except the willingness of employers to provide insurance. This has proved a weak and slow acting constraint. Within the system, doctors keep a tight control on the supply of doctors and doctor’s privileges. Hospitals maintain local monopolies on supply without regulatory constraint. Hospitals charge arbitrary amounts based on their costs and extract money from patients based on their ability to pay. This is a clear sign of monopoly. Again the regulators have been captured by the regulated. Health insurance is regulated by the States which fragments and weakens insurance market regulation. Health insurers in contrast are large national entities with far more clout than state regulators. Education: College education is the clearest education guild. Colleges charge based on the parents ability to pay, not the service they provide. Prices are raised without regard to costs. The benefits accrue to the guild members, not owners. The basis seems to be the exploitation of parent’s basic desire to help their children succeed in life. Recently this has assumed absurd levels where student debt now exceeds consumer debt. Many kids and parents were duped into borrowing excessively for worthless diplomas from corrupt diploma mills. A whole generation is starting out with a millstone around their neck that will damage them and the broader economy. K through 12 education is another guild. This guild operates to expand its membership and protect employment of its members. This is the opposite of skills based guilds like doctors that try to restrict entry and increase compensation Public servants: Most government spending occurs at the state and local level. Public sector unions have become adept at getting pro-labor local and state public officials elected by appealing to public sentiment. These officials have provided generous benefits to public employees, particularly generous pensions for police and fire. This is a clear case of regulatory capture. To summarize, modern guilds are hard to identify and have great defensive narratives that justify their excess remuneration. They also exploit complexity that misdirects attention. They also exploit natural human biases and weaknesses in their customers. Houses always increase in value. Doctors are altruistic. Only bankers understand banking. A good education is worth great financial sacrifice. Cops and firemen are heroes. Nurses and teachers are saints. By Edmund Kelly
Comments
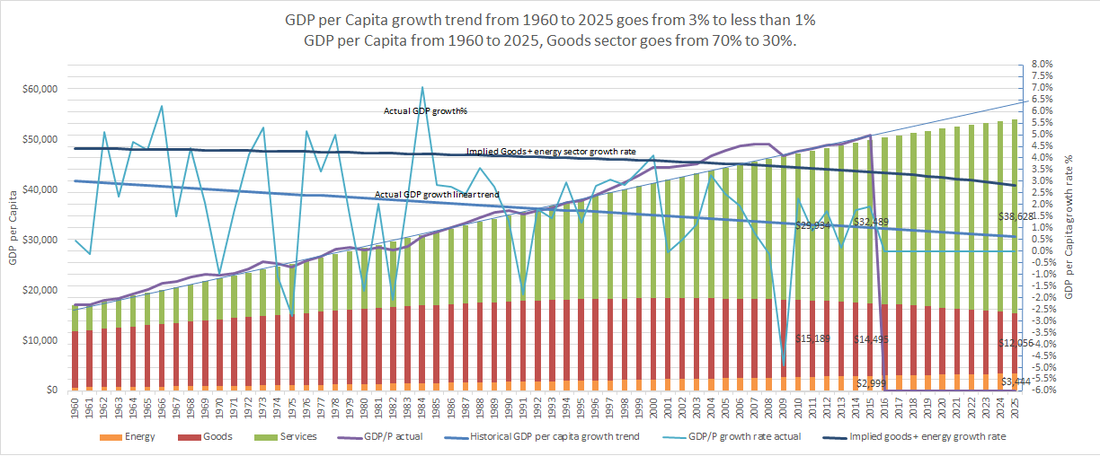
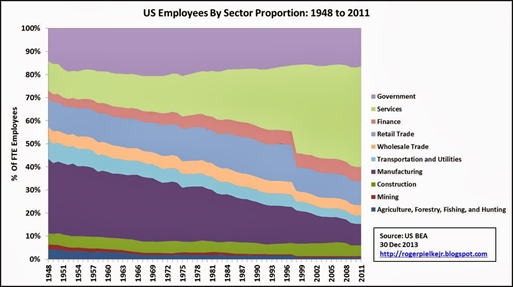
This graph shows real US GDP per capita statistics from the period of 1960 to the present (54 years) with extrapolated trends to 2025. The data is from the US Bureau of Economic Analysis and the US Census Bureau. The chart also shows some simple modeled data based on the actual data. The modeled data is the stacked bar chart of GDP and the goods sector GDP growth rate trend line. This makes for a busy chart but puts all the data in one place to show how the model matches the real data. The jagged light blue line shows actual GDP growth per year (axis on the right). The heavy blue line shows the linear trend of this jagged growth % line. This shows a steadily declining growth rate trend line that starts at 3% in 1960 and is currently at 1% in 2015. Looking at more recent periods shows an increasingly larger rate of decline, so this is optimistic. The wavy purple line shows real GDP per capita (axis on the left). The stacked bars show a calculated GDP per capita generated only from the declining growth rate trend line and an initial 1960 GDP value. This accurately tracks actual GDP with small variations which validates the accuracy of the trend extracted from the very jagged GDP growth rate data. Periods where GDP is above and below the bars are periods with above and below the trend growth rate. The biggest up deviation is the decade preceding the financial collapse in 2008. This aligns well with the view that the 2008 collapse was caused by a debt fueled bubble that artificially temporarily maintained a higher growth rate. This declining GDP growth rate trend implies that we may no longer be at the comforting 2% longer term 115-year trend in economic growth that still seems to be the conventional wisdom of economists and politicians. This is no small matter. Modern prosperity since the industrial revolution is based on a growing economy based on increasing productivity that steadily produces more output per person. A rising tide that raises all boats. A falling tide is a good explanation for the stagnant wages and growing income inequality of recent decades, as decreasing gains are captured by minority segments of the economy. So, what explains this potentially disastrous decline in GDP growth rate? It could be assumed to be uniform across the whole economy with all sectors declining in productivity every year. This would imply some malaise that applied uniformly to the economy as a whole. However, we know that various sectors of the economy have different productivity growth rates, some improving, some declining or flat. The graph above, again based on data from the Bureau of Economic Analysis and the Census Bureau, shows the proportion of employees in each economic sector from 1948 to 2011. This shows that manufacturing and goods producing sectors in the economy have roughly halved from 70% of employees to 35% of employees, while dramatically increasing the output of goods. This is the textbook definition of increasing productivity. It also shows that government has about the same 15% proportion of employees in 2011 as in 1948 for roughly the same government services, so there has probably been no overall productivity gain. The finance and services sectors have gone from 15% of employees in 1948 to 50% in 2011.
Given that we know the goods producing sector has maintained productivity, and the overall growth rate is declining, a simple first approximation would estimate no overall increase in growth rate for the finance and services sectors. This suggests a simple model that assumes the economy is divided into two broad sectors, a non productive sector NP that generates no GDP growth rate and a productive sector P that generates all GDP growth rate. This is probably an oversimplification, but the data shows it is very close to the truth. The stacked colored bars in the top graph represent GDP per capita (axis on the left) and illustrate two sectors P (productive) and NP (non productive) where GDP = P + NP. The red sector, P is set to 70% of GDP in 1960 and reduces to 35% of GDP in 2015. These numbers are chosen to approximately match the historical employment and gdp contribution of sectors in the economy shown in the employees by sector chart above. The following sectors are assumed to approximate a P sector: agriculture, mining, construction, manufacturing, transportation and utilities, wholesale trade and retail trade. Finance, services and government are the NP segment. This breakdown is oversimplified but broadly correct. These official statistics do not break out an energy sector. Energy is made up of pieces of other sectors mostly in the goods producing P segment. We know that energy consumption was around 8% of GDP in 2015. This means it was about 15% to 20% of the P sector. We know that energy’s contribution to GDP productivity growth as a sector is negative as it is taking more resources to produce the same energy over time. Using the historical decline in the overall rate of economic growth along with the historical reduction in the goods producing sector we can calculate a growth rate estimate for the P segment. This is shown with the purple line in the graph above. It starts at about 4.5% in 1960 and declines to about 3.5% in 2015. Given the increasing contribution of declining productivity energy sector to the goods producing P segment, it seems reasonable to infer that the energy sector is largely responsible for the 1% decline in P sector growth rate. The goods producing P sector is the engine of growth for the whole economy. The reduction in productivity of energy has a disproportionate affect on this engine of growth. To match the trend in overall growth rate decline, the graph shows that the decline in P sector growth rate is accelerating as energy becomes a larger fraction of the P sector. By 2025 if the current trend persists, the model shows that the non productive sector becomes 70% of the economy. The goods producing part of the economy is declining in absolute terms. The overall growth rate is well below 1%. This reduced rate of overall economic growth is already causing severe economic problems, contributing to income inequality and stagnant wages as the limited economic gains accrue to a powerful few. These problems will only get worse if the growth rate continues on its current downward trend. This illustrates that economic growth is a sensitive thing that cannot survive a large and growing part of the economy becoming less productive. This simple model shows that fixing the problem of lower growth means reducing the relative size of the non productive sectors. For the service sector problem areas, like finance, healthcare and education, the solutions are mainly political, but for energy the solution has to be mainly technological. By Edmund Kelly |
Archives
December 2023
Categories
All
|
|
© 2024 StratoSolar Inc. All rights reserved.
|
Contact Us
|


 RSS Feed