
Visualizations of the separation of the weather in the Troposphere from the Stratosphere
Typhoon Halong wind at ground level and statospheric wind at 18km altitude
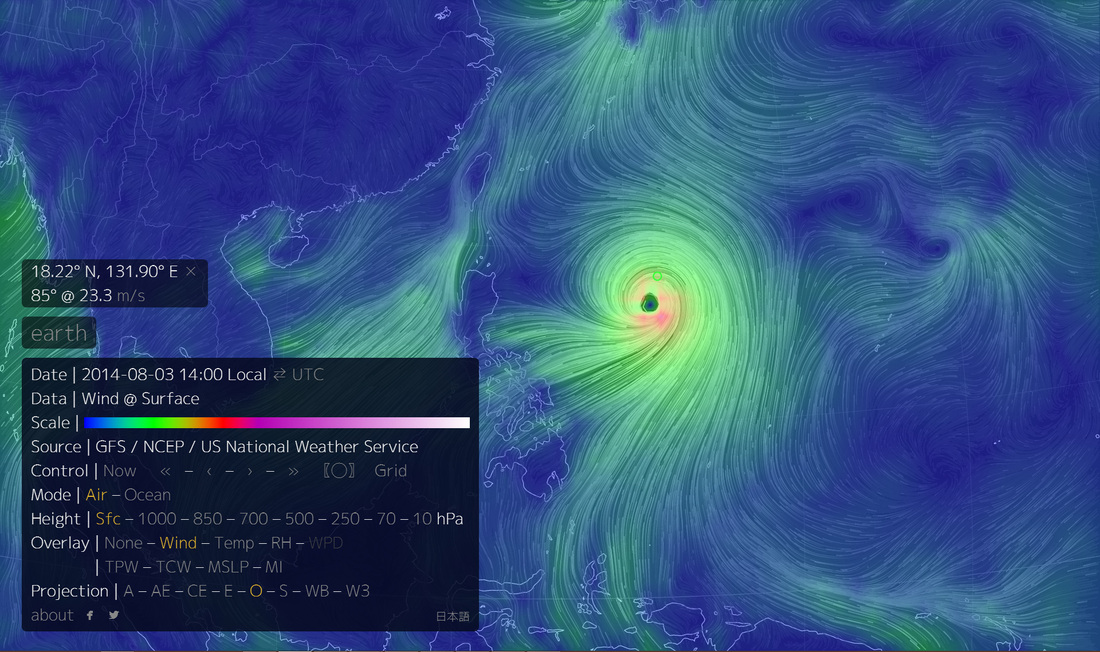
Typhoon Halong, August 3 2014
|
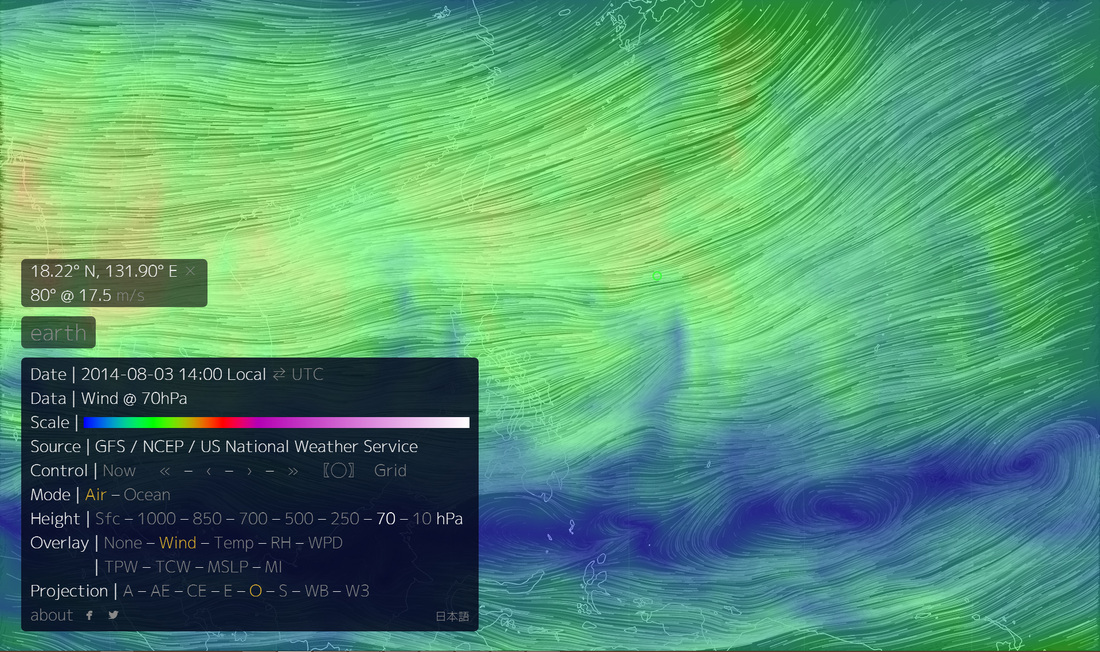
Stratospheric winds over Typhoon Halong August 3 2014
|
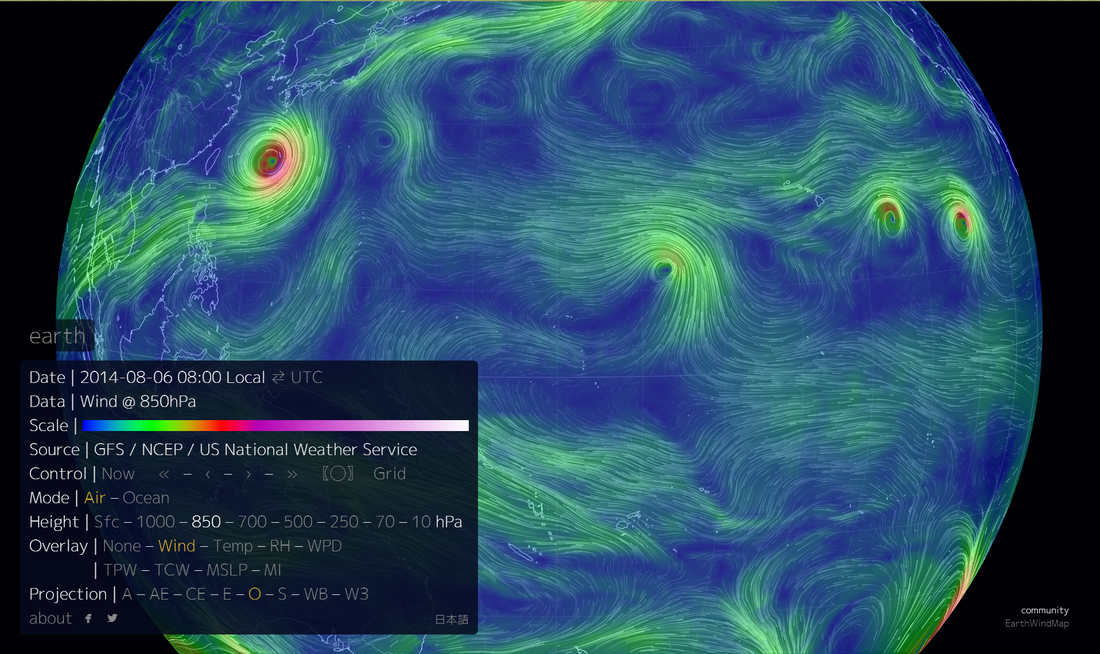
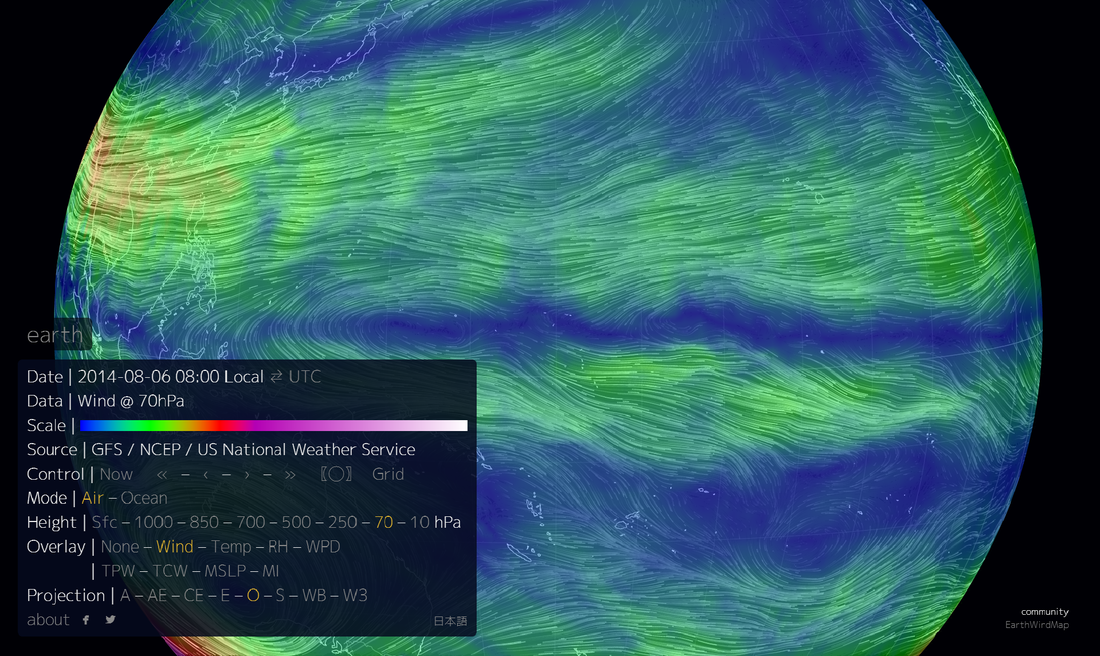
Typhoon Halong would be categorized as a Category 5 hurricane in the Atlantic. These images are snapshots of visualizations of wind speed based on satellite data. The image pairs are for the same time and location. Images on the left are for wind at ground level, images on the right are for winds in the low stratosphere. The top pair show typhoon Halong on August 3. The bottom left picture shows Typhoon Halong and two full blown hurricanes heading for Hawaii on August 6. The Wind speed at 70HPa (about 18km altitude) is benign and the uniform airflow shows no sign of the typhoon and hurricanes below. This link takes you to the visualization.
These images were obtained from this web site. Clicking on the "EARTH" button brings up a menu that presents a choice of layers for a variety of meteorological data gathered from satellites. This includes wind speeds and ocean currents and temperatures. It is easy to pan and zoom the image and a variety of projections are available. By using this visualization tool it is easy to verify the different nature of wind at ground level and at 70HPa altitude.
This tool makes it easy to understand various meteorological phenomena, including the winter polar vortices. The north pole vortex has a propensity to occasionally wander south every few winters. The south pole vortex is more regular and stronger than the north pole vortex. This is a view of the polar vortex over the US on 12/08/2013. This wandering south was responsible for extreme cold in the eastern US and caused high winds in the stratosphere as far south as Latitude 30.