StratoSolar PV electricity cost reduction roadmap:
Providing a path to an affordabale zero carbon future
Providing a path to an affordabale zero carbon future
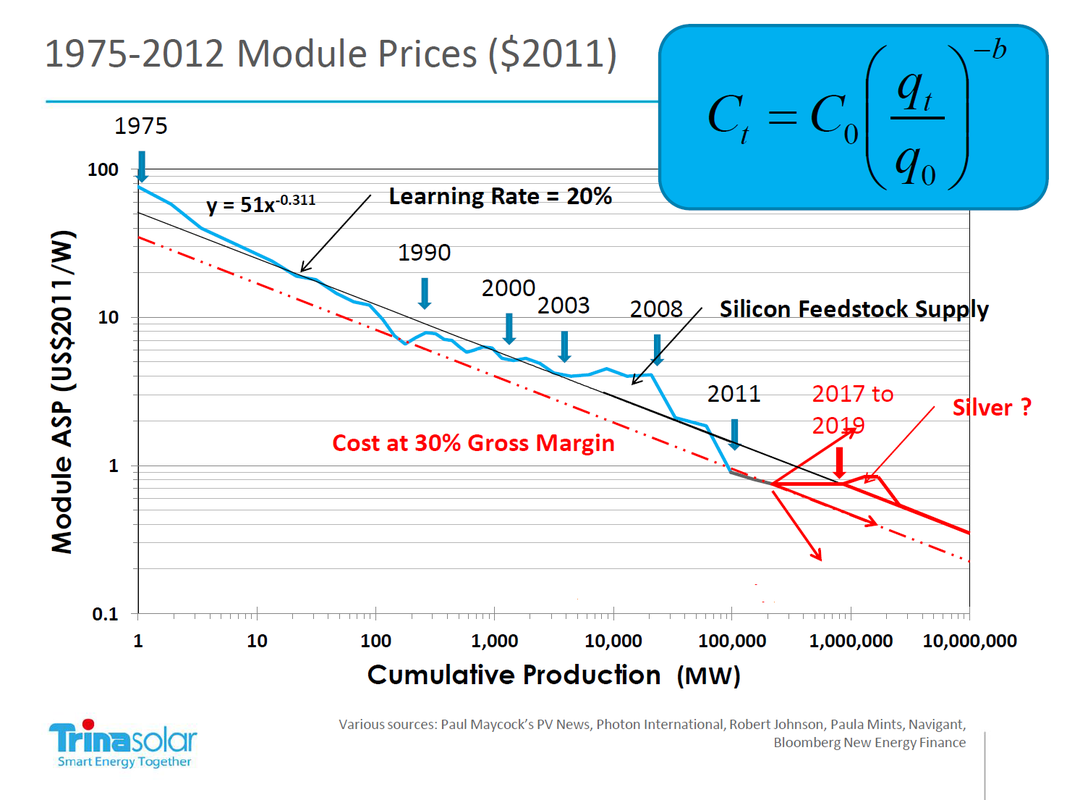
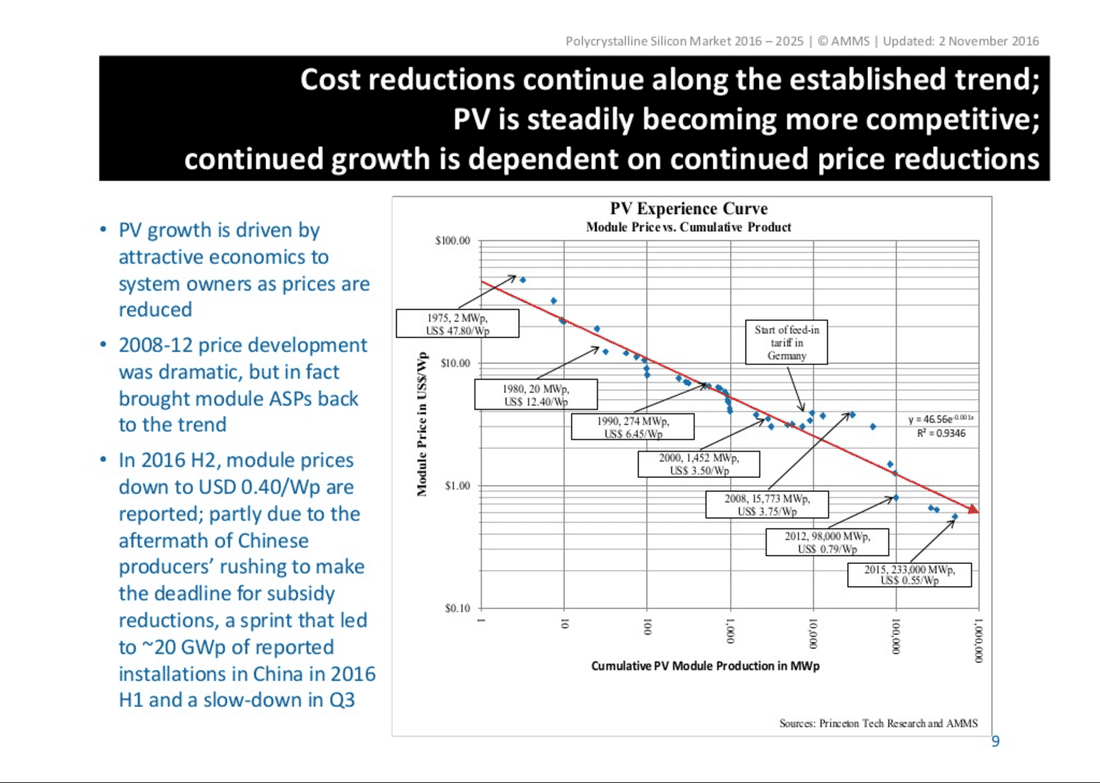
The forty year history of PV panel price reduction
As the graphs above from Trina Solar in 2012 and AMSS in H2 2016 show, crystalline Silicon (c-Si) PV panels have reduced in price considerably as cumulative production volume has increased. The trend lines show a learning rate of approximately 20%, which means for every doubling of cumulative volume, prices have reduced by 20%. Price reductions have been better than this 20% trend for a few years, which has led to over optimistic speculation that the learning rate has improved. However as the Trina graph illustrates, recent prices have been depressed by industry overcapacity and zero profit margins. The more recent AMSS graph shows prices returning to the 20% experience trend. The most likely PV module price projection for the next few years (out to 2020) is a relatively stable $0.40 to $0.75/Wp. This NREL document provides copious data on recent PV panel and system price trends that agree with the Trina and AMSS projections.
The graphs show that reliable predictions can be made over decades, but prices are much less predictable over yearly time frames. The many improvement factors that drive the 20% learning rate are still operating and long term price predictions based on this rate have a high confidence level. Unfortunately this rate of improvement still makes solar expensive and in need of subsidy in most markets for a long time to come.
The graphs show that reliable predictions can be made over decades, but prices are much less predictable over yearly time frames. The many improvement factors that drive the 20% learning rate are still operating and long term price predictions based on this rate have a high confidence level. Unfortunately this rate of improvement still makes solar expensive and in need of subsidy in most markets for a long time to come.
Projected future PV electricity generation cost reduction with growth in volume
The graphs that follow present succinctly the true state of current and future PV system capital costs and the resulting generated electricity costs, without the distortion of subsidies. They clearly show the significant reduction in electricity generation costs that StratoSolar's superior capacity factor brings to the table. The Cumulative Nameplate axis also illustrates the scale of growth necessary to replace fossil fuel energy.
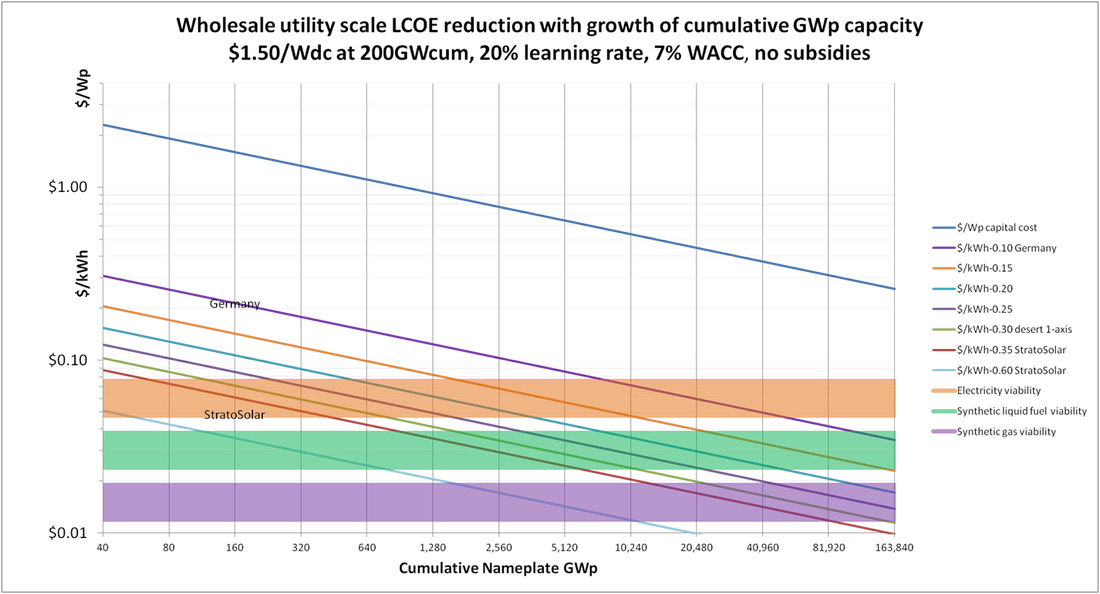
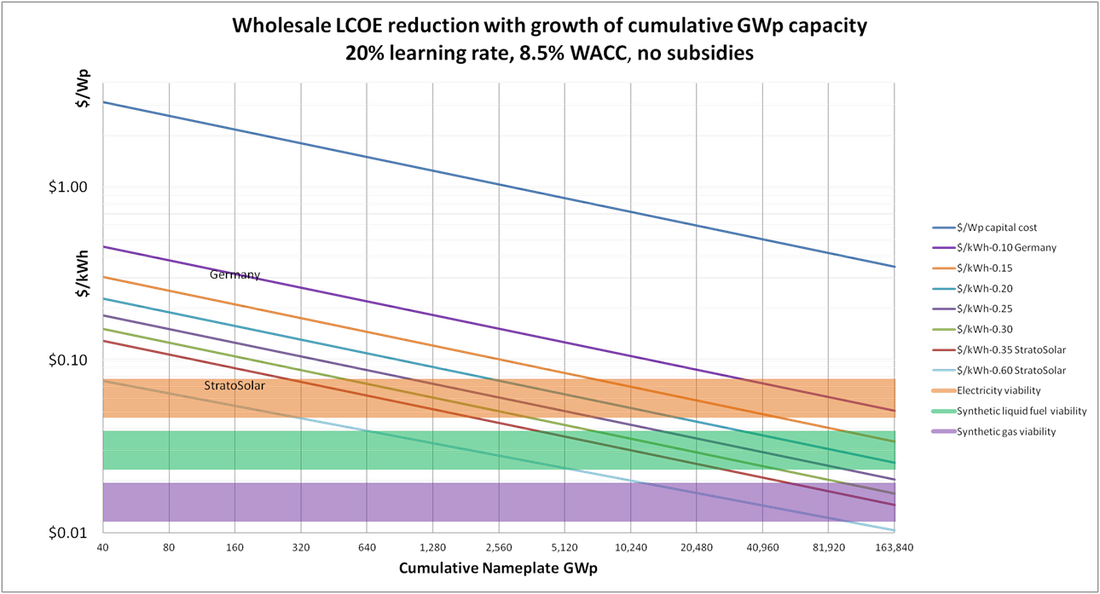
The figures above show future projections of the reduction in total utility scale PV system capital costs (PV modules + Bulk Of System (BOS)) in $/Wp (top line) and the resulting levelized cost of electricity(LCOE) in $/kWh with cumulative GWp installed capacity along the forty year historical 20% learning rate trend shown in the previous graphs (lower lines). The cumulative nameplate GWp axis in both charts is log2 going from 40 GW to 164 TWp, which illustrates the approximate scale of the growth required (from 2015's 200 GWp) to reduce CO2 emissions. The requirement to eliminate CO2 emissions is for between 20 TW and 30 TW of average generation capacity. This would be about 33 to 50 TW of Stratosolar nameplate capacity or about 150 to 250 TW of ground PV nameplate capacity.
Note that the previous historical graphs only show the PV module price learning curve, but historical BOS prices have reduced at approximately the same rate. These graphs also show that there is significant variation up and down along the trend line. The future projection graphs don't imply plain sailing, just the trend in a highly variable market. Also, to reiterate, these numbers represent utility scale PV prices for large PV arrays, not rooftop PV prices which are considerably higher.
LCOE trend lines are shown for several utilization factors that correspond to different geographic locations and tracking. The right graph shows an economically neutral prediction. This is for unsubsidized LCOE with a conservative 8.5% working average cost of capital (WACC) and assumes an average current capital cost of $2.00/Wdc at a 2015 cumulative capacity of about 200 GW. The optimistic case on the left is for unsubsidized LCOE with a 7.0% working average cost of capital (WACC) and assumes an average current capital cost of $1.50/Wdc at a 2015 cumulative capacity of about 200 GW.
A common way to refer to the variability in solar power input is to convert it to a utilization or capacity factor. This is useful when comparing different power plant technologies. Using this metric the lowest utilization (Northern Europe) is about 0.10, average for the US is about 0.15, desert is 0.20 to 0.25, (.30 with 1 axis tracking) and StratoSolar is about 0.35 flat to 0.60 with 1 axis tracking.
The horizontal band centered at $0.06/kWh represents wholesale electricity that is competitive in the marketplace without subsidy. The width of the band represents the variability in wholesale electricity costs for different markets. Europe has historically been at the high cost end of the band. This is an extremely significant barrier to cross. Above the band is the uncompetitive world of government subsidies, political volatility and subsidy constrained volume. Below the band is the world of competitive market economics, high growth and demand constrained volume.
The vertical distance from this $0.06/kWh band to the different utilization trend lines represents the approximate amount of subsidy needed. As can be seen, for the current cumulative GWp the subsidy is very large. For example the current subsidy for Germany is about $0.15/kWh. This subsidy shows up in different ways. In Europe the mechanism is mostly feed-in tariffs that result in higher costs of electricity to consumers. In the US, the mechanism is mostly tax credits and accelerated depreciation ultimately paid by taxpayers.
The synthetic liquid fuel and synthetic gas bands show the ranges where the reduction in LCOE enables the manufacture of affordable synthetic fuels using conventional manufacturing technologies that have already been proven at scale.
Interpreting what the graphs show: Ground PV is still too expensive
The trend lines show how much more accumulated production is necessary at different levels of sunshine (shown as utilization) for PV to become economically competitive with fossil fuel electricity. In 2015 the accumulated total is around 200GWp installed. As the graphs show, ground level PV will not generate economically competitive electricity until the total installed capacity has grown considerably. At current rates of growth this will take many years and an increasing amount of subsidy dollars. However, at current PV capital costs, StratoSolar can already generate electricity well below market competitive cost. In addition, with no clouds interrupting daytime generation, and integrated gravity energy storage for night time generation, StratoSolar has no additional hidden costs for backup, storage or transmission.
This charts clearly illustrate several points:
StratoSolar represents a low cost way to quickly leverage the historical investment in PV technology into commercial viability at all locations with today’s PV capital cost in $/Wp. This includes northern geographies where PV is unlikely ever to be commercially viable . This will still apply even if the historical rate of $/Wp improvement slows.
Note that the previous historical graphs only show the PV module price learning curve, but historical BOS prices have reduced at approximately the same rate. These graphs also show that there is significant variation up and down along the trend line. The future projection graphs don't imply plain sailing, just the trend in a highly variable market. Also, to reiterate, these numbers represent utility scale PV prices for large PV arrays, not rooftop PV prices which are considerably higher.
LCOE trend lines are shown for several utilization factors that correspond to different geographic locations and tracking. The right graph shows an economically neutral prediction. This is for unsubsidized LCOE with a conservative 8.5% working average cost of capital (WACC) and assumes an average current capital cost of $2.00/Wdc at a 2015 cumulative capacity of about 200 GW. The optimistic case on the left is for unsubsidized LCOE with a 7.0% working average cost of capital (WACC) and assumes an average current capital cost of $1.50/Wdc at a 2015 cumulative capacity of about 200 GW.
A common way to refer to the variability in solar power input is to convert it to a utilization or capacity factor. This is useful when comparing different power plant technologies. Using this metric the lowest utilization (Northern Europe) is about 0.10, average for the US is about 0.15, desert is 0.20 to 0.25, (.30 with 1 axis tracking) and StratoSolar is about 0.35 flat to 0.60 with 1 axis tracking.
The horizontal band centered at $0.06/kWh represents wholesale electricity that is competitive in the marketplace without subsidy. The width of the band represents the variability in wholesale electricity costs for different markets. Europe has historically been at the high cost end of the band. This is an extremely significant barrier to cross. Above the band is the uncompetitive world of government subsidies, political volatility and subsidy constrained volume. Below the band is the world of competitive market economics, high growth and demand constrained volume.
The vertical distance from this $0.06/kWh band to the different utilization trend lines represents the approximate amount of subsidy needed. As can be seen, for the current cumulative GWp the subsidy is very large. For example the current subsidy for Germany is about $0.15/kWh. This subsidy shows up in different ways. In Europe the mechanism is mostly feed-in tariffs that result in higher costs of electricity to consumers. In the US, the mechanism is mostly tax credits and accelerated depreciation ultimately paid by taxpayers.
The synthetic liquid fuel and synthetic gas bands show the ranges where the reduction in LCOE enables the manufacture of affordable synthetic fuels using conventional manufacturing technologies that have already been proven at scale.
Interpreting what the graphs show: Ground PV is still too expensive
The trend lines show how much more accumulated production is necessary at different levels of sunshine (shown as utilization) for PV to become economically competitive with fossil fuel electricity. In 2015 the accumulated total is around 200GWp installed. As the graphs show, ground level PV will not generate economically competitive electricity until the total installed capacity has grown considerably. At current rates of growth this will take many years and an increasing amount of subsidy dollars. However, at current PV capital costs, StratoSolar can already generate electricity well below market competitive cost. In addition, with no clouds interrupting daytime generation, and integrated gravity energy storage for night time generation, StratoSolar has no additional hidden costs for backup, storage or transmission.
This charts clearly illustrate several points:
- The same plant with the same capital cost produces electricity with highly variable cost depending on location. E.g. at a $1.70/Wp capital cost and 200 GW cumulative capacity, Northern Europe generates electricity for about $0.25/kWh, and StratoSolar generates electricity for less than $0.03/kWh. StratoSolar has the best location in the stratosphere (which can be over northern Europe) and lowest unsubsidized cost.
- The $1.70/Wp capital cost is approximately the 2015 cost. At historical rates of improvement for current cumulative volume growth projections, ground based PV electricity will not become competitive without subsidy in most markets for a very long time.
- StratoSolar will produce electricity that is competitive without subsidy using today's $1.70/Wp PV technology and will benefit equally from the PV $/Wp cost improvement path, producing increasingly competitive lower cost electricity.
- StratoSolar can do this for northern climes for which PV is not an economically viable option.
StratoSolar represents a low cost way to quickly leverage the historical investment in PV technology into commercial viability at all locations with today’s PV capital cost in $/Wp. This includes northern geographies where PV is unlikely ever to be commercially viable . This will still apply even if the historical rate of $/Wp improvement slows.


