Why StratoSolar works: A PV platform located in an environment with abundant sunshine that is permanently free from bad weather:
StratoSolar is based on an understanding of several fixed features of the earth's atmosphere and environment, in particular, the understanding that the stratosphere is a separate, relatively benign environment, isolated from the troposphere. This understanding is not intuitive and is central to scepticism about the practicality of permanently deployed StratoSolar platforms.
Key insights:
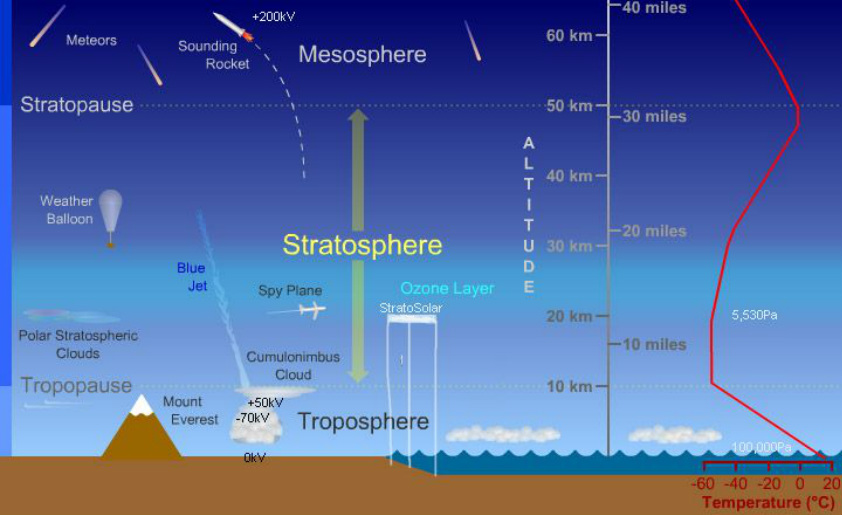
First, there is a permanent inversion layer in the earth’s atmosphere that forms at the tropopause boundary between the troposphere and the stratosphere. Generally atmospheric temperature falls with altitude. However oxygen has an absorption band in the UV spectrum. One effect of this absorption of UV radiation is the protection of life on the earth's surface. The absorption mainly happens in a band above 20km altitude called the ozone layer. The UV absorption causes the atmosphere to warm creating a warmer layer of air over a colder layer of air below. This temperature inversion is shown by the atmospheric temperature graph on the right in the picture below. This warmer layer of air over a colder layer of air is called an inversion layer. This inversion layer is a permanent feature of the earth's atmosphere that separates the troposphere from the stratosphere.
Inversion layers effectively isolate gas bodies. This means that the calm weather free stratosphere is physically isolated from the turbulent troposphere below. There is no rain, hail, snow, or moisture in the stratosphere The worst case wind force is more than an order of magnitude lower than in the troposphere. There is also no turbulence and wind speed is steady and changes slowly. Even severe weather events in the troposphere like thunderstorms and hurricanes have no effect in the stratosphere at 20km (65,000 feet) altitude. This means that buoyant, tethered, platforms suspended in the stratosphere don't have to sustain large wind forces and can be permanently stationed there without needing to be winched down during bad weather in the troposphere. The bad weather in the troposphere only affects the tethers which are thin and very strong and robust.
Second, light from the sun at 20km altitude is both strong and constant from dawn to dusk. At 20km (65,000 feet) a platform is above over 90% of the atmosphere, so sunlight is not significantly scattered or absorbed and there are no clouds to interrupt power generation. This means that on average, PV panels produce multiples of the energy they can generate on the ground, and just as important, the energy is highly predictable and not subject to interruption by clouds or storms.
Third, the 20km (65,000 feet) altitude allows relatively small weights suspended from platforms to store large amounts of gravitational potential energy, sufficient to provide nighttime electricity demand and adjust power output with a response time of seconds.
First: Weather in the Stratosphere:
The figure above helps illustrate where a StratoSolar PV system sits in the atmosphere and its relationship to various phenomena at mid latitudes. The buoyant PV platform, tethered to the ground, shown in the figure is floating in the stratosphere at the bottom of the ozone layer where the air temperature is about -55 to -65 degrees Celsius. Though diagrammatic, other than the spy plane and balloon everything is scaled and positioned appropriately, including the average depth of the ocean at 4km.
As the figure shows in the temperature graph on the right, air temperature falls with increasing altitude until leveling off at about -60C at altitude 10km. Temperature then holds steady up to 20km when it starts to rise, eventually warming to about 0C at altitude 50km. This leveling off and then rising temperature is driven by ultra violet sunlight radiation being absorbed by oxygen, creating the ozone layer, warming the atmosphere and protecting life at the surface from harmful UV radiation. Without the ozone layer, atmospheric temperature would fall continuously with altitude and there would be no separate layers in the low earth atmosphere. The UV absorption creates a relatively warmer layer in the atmosphere separating the warmer stratosphere, stretching from altitude 20km to 50km, from the colder troposphere below. Winds in the Stratosphere are relatively low speed, steady and horizontal. There are no clouds or moisture and no storms. The most significant feature is the polar vortices which form around each pole in its winter and can have winds exceeding 50 m/s. The northern polar vortex is prone to wander south every few winters for a few weeks, bringing very cold weather and stratospheric winds of 40 to 50 m/s as far south as latitude 30.
The cumulonimbus cloud illustrates the relative scale and altitude of a severe super-cell thunderstorm, the most violent weather event that affects the tethers in the troposphere. Some super-cell thunderstorms can push up the tropopause and top out close to 17km. A small percentage spawn tornadoes. The jet stream, another strong wind phenomenon in the troposphere that affects the tethers is not shown explicitly, but when present it would be positioned just below the tropopause and be a few km thick. Original artwork by Windows to the Universe staff (Randy Russell)
This image is derivative from content on Windows to the Universe® (http://windows2universe.org) © 2010, National Earth Science Teachers Association. This work is licensed under a Creative Commons Attribution-ShareAlike 3.0 Unported License.
Second: Solar Insolation in the Stratosphere:
Average daily solar energy at 20 km altitude is about 3X higher than at ground level for the same location.
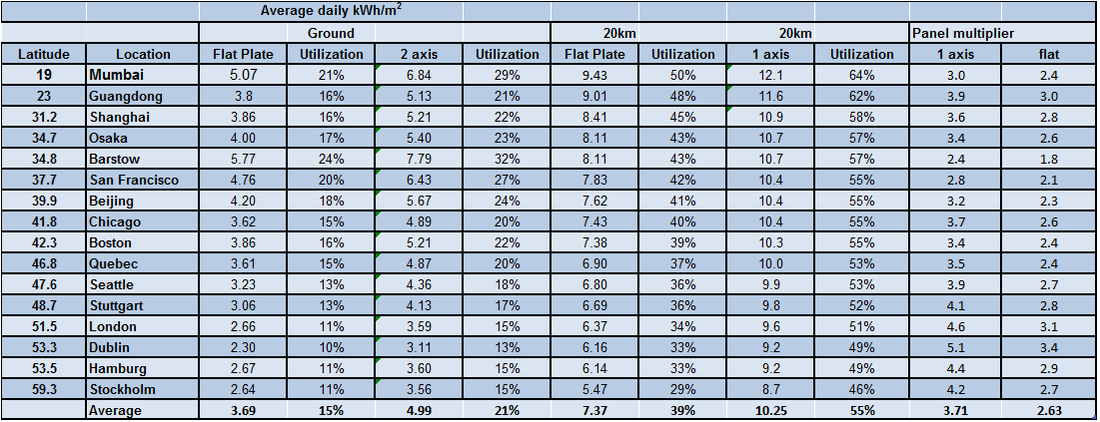
The diagrams above show average daily solar insolation in kWh/m^2/day throughout the year for selected large urban locations from latitude 23 to latitude 60. The blue lines are the measured ground energy level (from NASA SSE data) and the red lines the StratoSolar energy level (from simulation of atmospheric scattering and absorption). The StratoSolar insolation is very close to measured Top of Atmosphere insolation which is also available in the SSE database as a convenient cross check. The table condenses this data into daily average solar insolation and associated PV power plant utilization or capacity factor on the ground and at 20 km altitude for the same locations.
PV power plant utilization or capacity factor represents the percentage of nameplate power (Wp) the PV plant actually produces. It includes the solar insolation percentage shown, along with the average effects of tracking, PV efficiency with temperature and system losses from power conversion, reliability, cleaning etc. As can be seen from the graphs and the table, largely because of the average 3X increase in solar insolation, StratoSolar utilization averages about 3X ground utilization (or capacity factor). These graphs highlight the benefit of StratoSolar at all geographies. All major urban areas can have locally generated, cost competitive, solar electricity, without providing backup generation or major transmission upgrades to their electricity grids.
For those who like numbers, the solar insolation contribution to average yearly utilization is calculated as follows. A PV panel's nameplate electricity output is specified in peak Watts (Wp) for a standardized sunlight input of 1 KW/m^2. The measured data for the daily average solar insolation in W/m^2 over a year at ground level for locations around the world is available in the NASA SSE database, and other national sources. Name plate electrical energy produced per square meter for one day would be based on 24 hours of solar insolation at 1 kW/m^2, which is 24 kWh/m^2. For example, if average daily insolation is 3.8 kWh/m^2, as at Guangdong in China, that is a PV panel utilization or capacity factor of 3.8/24 which is 16%. So if a PV panel has a rated electrical power output of say 250W, its average electrical power output at Guangdong is 250*.16 or 40W. The PV panel electrical power output is further reduced by losses in wiring and inverters. Panels also suffer losses from dirt, deterioration with age and failure of panels and inverters. Typically these losses are between 15% and 20%, reducing the PV panel average output from 40 W to from 32 W to 35 W. Panel output can be increased by about 25% by tracking the sun. This benefit has additional costs for stronger mechanical supports, tracking motors and electronics and additional land for wider spacing between panels. The overall cost increase can easily outweigh the gain in capacity factor with no net benefit in $/W.
Ground insolation data comes from:
NASA Surface meteorology and Solar Energy (SSE) Release 6.0 Data Set (Jan 2008) 22-year Monthly & Annual Average (July 1983 - June 2005)
Parameter: Insolation Incident On A Horizontal Surface (kWh/m^2/day) Internet: http://eosweb.larc.nasa.gov/sse/
This table shows more detail than the smaller table above. It adds columns for tracking and the ratio of improvement of StratoSolar over ground flat plate. This shows the word-wide average utilization for StratoSolar with 1-axis tracking is 55%, varying from 46% at Stockholm to 64% at Mumbai. Compare this StratoSolar 55% utilization to the worldwide average utilization of PV at ground level of 15%, more than a 3X improvement. When deployed in volume with gravity energy storage, StratoSolar PV will all be 1-axis tracking. Because of a order of magnitude lighter weight panels and an order of magnitude lighter wind forces, the added cost of 1-axis tracking for StratoSolar is a small fraction of the added cost of 1-axis tracking for ground PV.
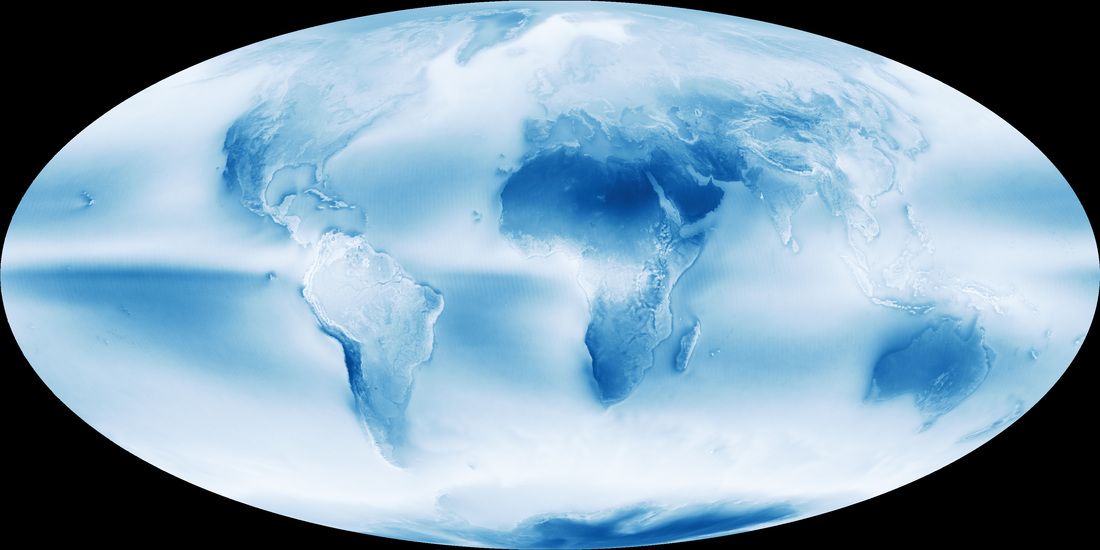
A visual representation of the effect of clouds on insolation
Earth’s cloudy nature is unmistakable in this global cloud fraction map, based on data collected by the Moderate Resolution Imaging Spectroradiometer (MODIS) on the Aqua satellite. While MODIS collects enough data to make a new global map of cloudiness every day, this version of the map shows an average of all of the satellite’s cloud observations between July 2002 and April 2015. Colors range from dark blue (no clouds) to light blue (some clouds) to white (frequent clouds). Clicking on the image will take you to the NASA Earth Observatory site.
Part of the explanation for low ground level solar insolation levels is clouds. This picture from NOAA, neatly illustrates the impact of clouds on solar insolation. Most of the world's population is in regions with heavy cloud cover. This includes Europe, China, Asia and North America. This picture illustrates how truly exceptional California is as a heavily populated region in a desert.
Clouds introduce two problems. They reduce average insolation which reduces utilization, but perhaps more importantly, they can significantly reduce insolation over long periods lasting weeks. The only current solution to this daytime intermittency problem is backup fossil fuel generation capacity of a similar magnitude to PV generation capacity. The developed world already has adequate fossil fuel generation capacity, so the impact is to reduce the utilization of existing fossil fuel power plants, which at low levels of PV generation is a relatively low cost. However in the developing world, they are adding new generation capacity, so adding PV in significant amounts will need new matching fossil fuel backup generation. Even in the developed world at any significant market penetration of solar, the cost burden of backup generation grows rapidly and quickly exceeds the cost of solar generation.
Another untested solution to daytime intermittency is to build excess alternative energy generation capacity and connect it with long distance transmission lines. This relies on geographically separated areas not sharing the same daytime intermittency events. This approach is inherently probabilistic and will fail occasionally. The amount of long distance transmission this approach entails is many multiples of current long distance transmission and along with the excess capacity would add significant cost and have significant political opposition.
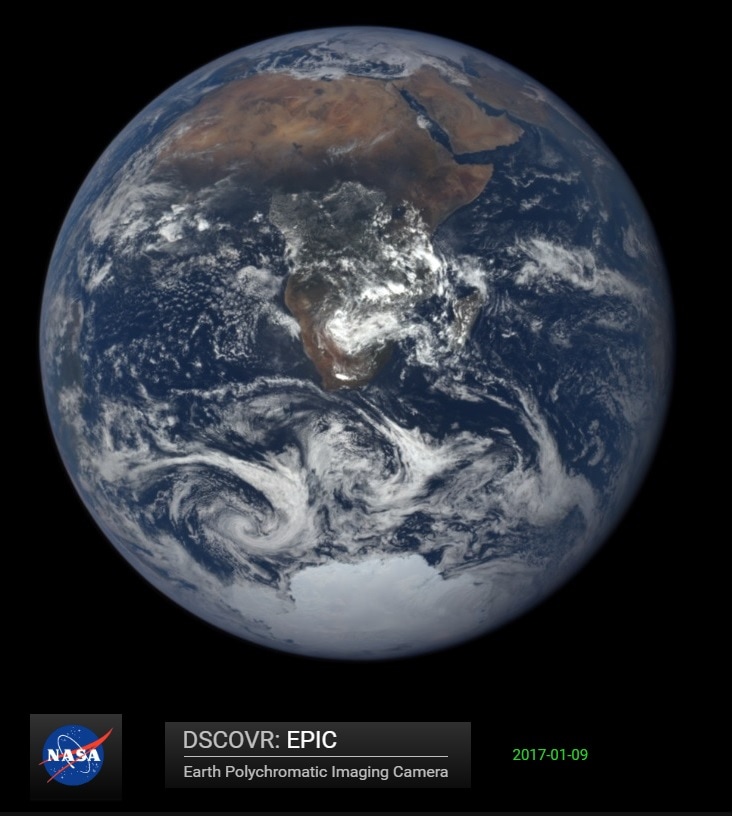
A visual representation of the effect of geography on insolation
This is an image from the NASA EPIC camera on board the DSCOVR satellite which permanently stares at the sun facing side of earth from an L1 vantage point between the earth and the sun. This is a view taken by the EPIC team on January 9, 2017. It shows a typical northern winter view. Notice how Europe is barely visible at the top of the image, and what is visible is covered in clouds. This graphically illustrates how little sunshine there is over Europe and other northern latitudes in the winter. Clicking on the image will take you to the NASA site.
Wind Force at 20 km (65,000 feet) Altitude:
This website shows a visualization of wind speed and direction at an altitude of 20km. click on a location for wind speed. the default is in km/h. clicking on km/h will get m/s. This paper discusses an analysis of wind variability at 20km altitude.
The highest winds at 20 km altitude are in the polar vortex which circles the poles in winter. It is usually located above latitude 50 but sometimes wanders into lower latitudes for a period of weeks as it did in the US the winter of 2014 link. Polar vortex winds do not exceed 200 km/h (55m/s). Combined with the lower air density at 20 km altitude (<0.1 kg/m^3), this 55 m/s wind speed means that the maximum wind force is around 150 Pa, more than a factor of ten less than the 2000 Pa maximum wind force experienced by tall buildings and large structures at ground level due to higher wind speeds (> 100 m/s) and higher air density (> 1 kg/m^3) at ground level. Winds at 20 km also exhibit little to no turbulence.
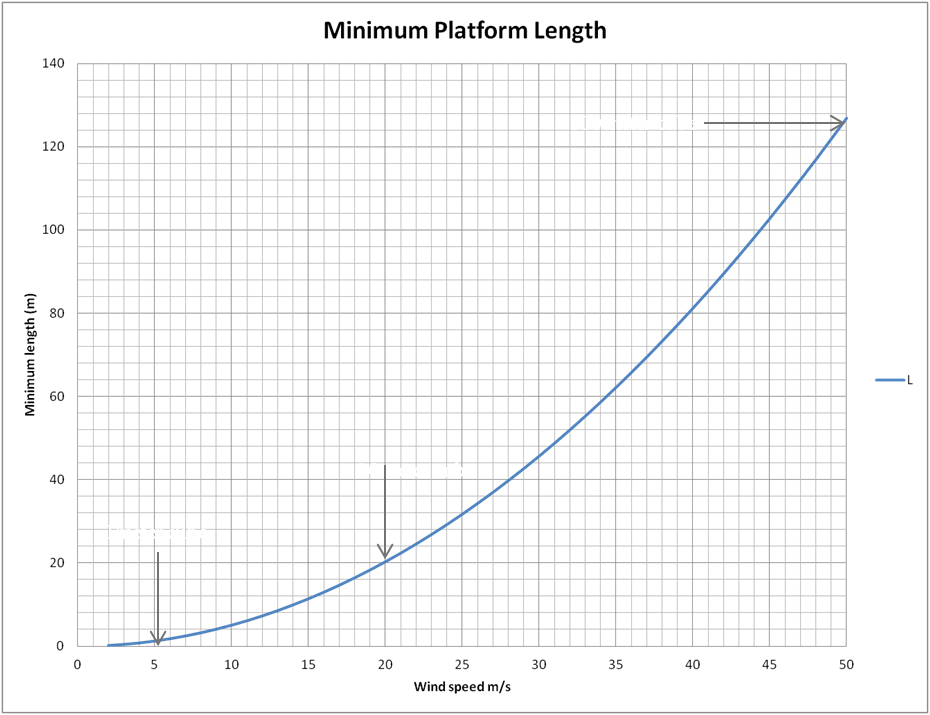
The graph below shows theoretical minimum platform length for tethered buoyant platforms at different wind speeds. Real platforms need to be about twice as long to account for platform and payload weight and tether weight and wind force. As the graph shows, smaller platforms can operate at low wind speeds but need to be winched down when wind exceeds their operational maximum wind. This wind scaling can be exploited to build smaller test platforms to test engineering aspects of large platforms.
From the graph it is clear that to counter worst case wind speeds of 50 m/s at 20 km, real platforms need to be about a minimum of 300 meters long. This is larger than any buoyant airship ever constructed. The innovation of StratoSolar is to first recognize the scale required and then develop the unique methods necessary to construct and deploy such large fragile objects.
Given the worst case wind speeds in the troposphere approaching 100 m/s and the higher air density, permanently airborne platforms there would have to approach 1 km in length and sustain forces an order of magnitude larger, along with severe turbulence and vertical wind shear. This is almost certainly technically impossible with current technology.

