How StratoSolar generates electricity at a low cost:
For current ground based PV solar-power plants, almost the complete operating cost is the equivalent of a yearly loan payment that pays off the capital cost of building the plant. The StratoSolar PV system generates electricity at a low market competitive cost mostly because the solar PV array (which dominates PV cost) uses the same mass produced PV technology and therefore has a similar capital cost to current ground based PV power plants. However it generates 3X more electricity. This is because with access to three times the daily average solar energy available on the ground it has a much higher utilization or capacity factor. This results in low cost electricity that is market competitive without subsidy at current PV panel costs.
In detail, the reasons for this are:
In addition, the uninterrupted highly predictable StratoSolar-PV power generation does not need backup generation, and the power plants can be where they are needed rather than in deserts thousands of kilometers away. With the addition of gravity energy storage StratoSolar provides a complete dispatchable electricity generation solution. These benefits offer significant additional cost advantages to StratoSolar, but the benefits are far larger than economic. As PV is attempting to be accepted as a viable utility scale electricity option these problems (backup, energy storage and additional transmission) are the major barriers to PV's acceptance as a viable technology for large-scale electricity generation that can replace fossil fuels.
As part of an integrated fossil fuel free electricity grid, PV in the stratosphere combined with gravity energy storage could provide the bulk of electricity requirements at a lower market cost than fossil fuels, with nuclear, hydro and wind covering the rest. Such an integrated electricity grid could have a zero carbon footprint and produce electricity with the lowest cost, the highest price stability and the best energy security.
StratoSolar is a commercially competitive alternative energy solution. By not covering huge land areas, it saves on an expensive, highly regulated, and uncertain resource that tends to delay construction and limit financing options. It also allows great flexibility in location. The competitive and highly profitable economics should lead to a business that is market financed and does not need government support or subsidy once demonstrated. It is a bonus that this lower cost energy is carbon-free, and solves energy security issues.
In detail, the reasons for this are:
- The PV panels are exposed to 1.5 to 4.0X the solar energy (in kWh) of ground-based PV panels, depending mostly on Latitude
- This means each square meter of PV panel generates 1.5 to 4.0X the electricity of ground-based PV panels
- The c-Si PV panels are 20% to 30% more efficient due to a -30C to -40C operating temperature at the -60C ambient at 20km altitude.
- There are no losses from dirt or water based PV panel degradation.
- The PV array uses no land. There is only a small land use for tether anchors and a small site development cost for the assembly area.
- The PV array buoyant support structure uses very little material due to light structural loads.
- The PV array buoyant support structure production is highly automated. Labor costs for construction and assembly are greatly reduced.
- All construction materials are standard aluminum and plastic film, available off the shelf, in volume and at low cost.
- The PV panels use much less material; 2 kg/m2 compared to 15 kg/m2.
- Gravity energy storage is low cost, adding only additional buoyancy, winches, cables and weights.
In addition, the uninterrupted highly predictable StratoSolar-PV power generation does not need backup generation, and the power plants can be where they are needed rather than in deserts thousands of kilometers away. With the addition of gravity energy storage StratoSolar provides a complete dispatchable electricity generation solution. These benefits offer significant additional cost advantages to StratoSolar, but the benefits are far larger than economic. As PV is attempting to be accepted as a viable utility scale electricity option these problems (backup, energy storage and additional transmission) are the major barriers to PV's acceptance as a viable technology for large-scale electricity generation that can replace fossil fuels.
As part of an integrated fossil fuel free electricity grid, PV in the stratosphere combined with gravity energy storage could provide the bulk of electricity requirements at a lower market cost than fossil fuels, with nuclear, hydro and wind covering the rest. Such an integrated electricity grid could have a zero carbon footprint and produce electricity with the lowest cost, the highest price stability and the best energy security.
StratoSolar is a commercially competitive alternative energy solution. By not covering huge land areas, it saves on an expensive, highly regulated, and uncertain resource that tends to delay construction and limit financing options. It also allows great flexibility in location. The competitive and highly profitable economics should lead to a business that is market financed and does not need government support or subsidy once demonstrated. It is a bonus that this lower cost energy is carbon-free, and solves energy security issues.
3 times ground level solar insolation at 20 km altitude reduces PV generated electricity cost to one third the cost of ground PV (in $/kWh):
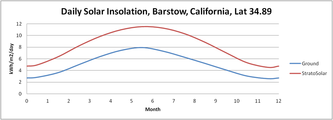
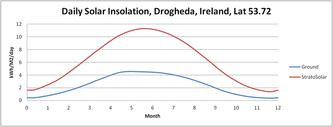
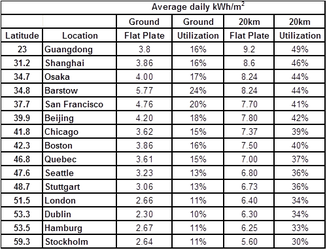
The diagrams above show average daily solar insolation in kWh/m^2/day throughout the year for selected locations from latitude 23 to latitude 60. The blue lines are the ground energy level (from NASA data) and the red lines the StratoSolar energy level (from simulation of atmospheric scattering and absorption). The table condenses this data into daily average solar insolation and associated PV power plant utilization or capacity factor on the ground and at 20 km altitude for the same locations.
PV power plant utilization or capacity factor represents the percentage of nameplate power (Wp) the PV plant actually produces. It includes the solar insolation percentage shown, along with the average effects of tracking, PV efficiency with temperature and system losses from power conversion, reliability, cleaning etc. As can be seen from the graphs and the table, largely because of the average 3X increase in solar insolation, StratoSolar utilization averages about 3X ground utilization (or capacity factor). These graphs highlight the benefit of StratoSolar at all geographies. All major urban areas can have locally generated, cost competitive, solar electricity, without adding backup or major transmission upgrades to their electricity grids.
The solar insolation contribution to average yearly utilization is calculated as follows. A PV panel's nameplate electricity output is specified in peak Watts (Wp) for a standardized sunlight input of 1KW/m^2. The measured data for the daily average solar insolation in W/m^2 over a year at ground level for locations around the world is available in the NASA SSE database, and other national sources. Name plate electrical energy produced per square meter for one day would be based on 24 hours of solar insolation at 1 kW/m^2, which adds up to 24 kWh/m^2. So if average daily insolation is 3.8 kWh/m^2, as at Guangdong in China, that is a PV panel utilization or capacity factor of 3.8/24 which is 16% (0.16). So if a PV panel has a rated electrical power output of say 250W, its average electrical power output at Guangdong is 250*0.16 or 40W. The PV panel electrical power output is further reduced by losses in wiring and inverters. Panels also suffer losses from dirt and deterioration.with age. Typically these losses are between 15% and 20%, reducing the system output from 40 W to 32 W to 35 W.
Ground insolation data comes from:
NASA Surface meteorology and Solar Energy (SSE) Release 6.0 Data Set (Jan 2008) 22-year Monthly & Annual Average (July 1983 - June 2005)
Parameter: Insolation Incident On A Horizontal Surface (kWh/m^2/day) Internet: http://eosweb.larc.nasa.gov/sse/
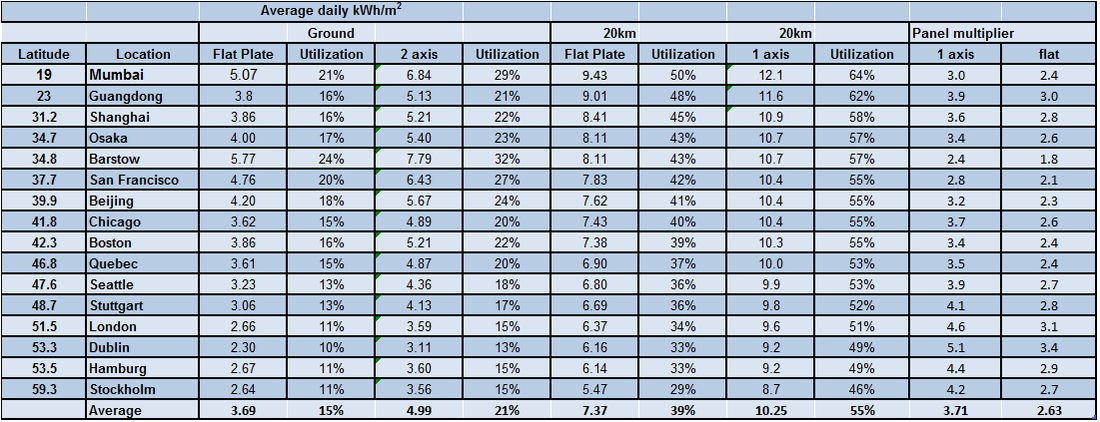
This table shows more detail than the smaller table above. It adds columns for 1 axis tracking and the ratio of improvement of StratoSolar over ground flat plate.


