|
PV is not a free market. It is dominated by China and the peculiarities of the Chinese economy. China is both the largest manufacturer and the largest consumer of PV. This has all occurred extremely rapidly over about the last five years. 2017 appears to potentially be a year of reckoning for PV, as this blog article neatly summarizes. The total historical PV cumulative installed capacity is about 300GW, most of it installed over the last few years. 2016 Installed capacity alone was about 70GW, with about 30GW of that in China. US installed a record 12GW in 2016, driven by the potential expiration of subsidy incentives. Most projections have 2017 world PV installations falling well below the 2016 70GW due to reductions in China and the US, with no major new growth area to compensate.
These reductions stem in part from the limited ability of electricity grids to absorb PV. The long-term limit is based on the capacity factor limit of grids to absorb intermittent sources. We are far from this limit, but short term constraints are showing up at very low levels of PV penetration. China’s current limit is the lack of long distance transmission capacity to take the power from the deserts in the west to the users in the east. As discussed in this blog post, California is hitting problems due to the inability of fossil generation to ramp up and down quickly enough to compensate for rapidly changing PV generation as the sun sets. Advocates for PV are focused on the falling cost of PV generation and seem to assume that once PV becomes the lowest cost of generation the world will magically switch to solar energy. The reality is far from this rosy scenario. The real cost of PV electricity will increasingly have to factor in the additional costs needed to incorporate it into the electricity supply system. California is showing the need for storage at very low levels of penetration and China is showing the need for long distance HV-transmission. Both technologies are expensive and in need of development, particularly electricity storage. They are both additions to the current grid and both exceed the cost of PV generation. Add to this the geographical variability of solar, particularly at northern latitudes and the economic case for solar to be a large scale, economically viable supplier of electricity is far in the future. StratoSolar is low cost generation with low cost, fast response storage built in and no need for long distance transmission. It has no daytime intermittency problem and it works well at northern latitudes. It needs relatively minor short term development to prove its viability. In contrast, the storage and HVDC transmission technologies needed to make ground PV viable are in many ways more speculative, unproven and longer term than StratoSolar. By Edmund Kelly
Comments
The attached white paper is a more comprehensive look at the impact of higher energy costs on reducing GDP growth. This tells us two things. First, we are in serious economic trouble already with a low and declining rate of economic growth from the continually increasing cost of fossil fuels. Second, replacing fossil fuels with more expensive alternative energy sources will only make the problem worse. So far, wind and solar have been a relatively small economic factor, but growth to a level where they can contribute to a significant reduction in CO2 emissions would quickly get us into economic decline, and the political unrest that comes with economic decline. StratoSolar's lower cost of energy production than fossil fuels can reverse the current decline in the rate of economic growth by making energy cheaper on a continuing basis. By Edmund Kelly
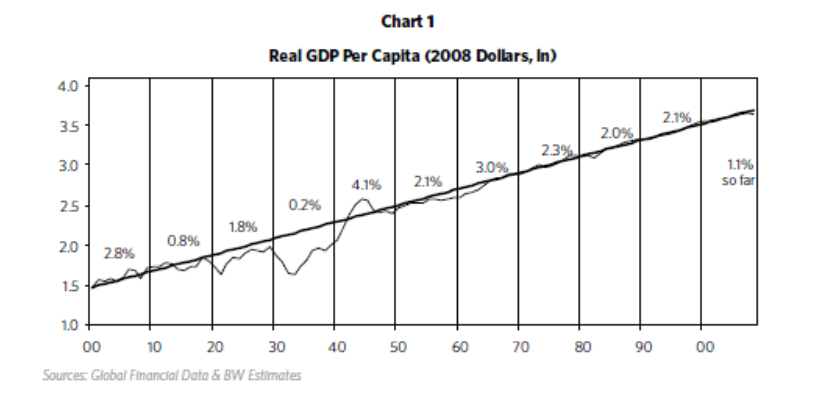
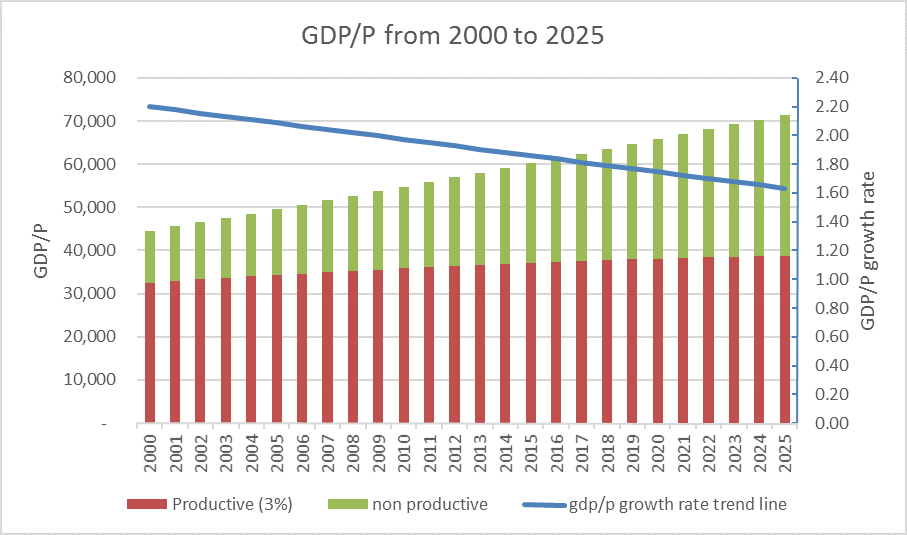
An argument against large scale deployment of alternative energy is the negative impact of the higher cost on gdp growth. The following is an attempt to quantify this effect based on the increasing cost of energy since around 1970. The modern world is based on sustained economic growth. As the chart below shows, US real gdp per capita has maintained an overall 2% per annum growth rate through depression, recessions and two world wars. This has been possible because of technological advances increasing the productivity of all economic sectors. Since around 1970, the cost of producing energy has steadily risen. Initially this was driven by the increasing cost of oil production, and more recently the cost of expensive alternative energy production has also become a significant factor. Energy is a significant part of gdp, so its share growing from around 5% to around 10% of gdp should clearly have been a drag on the growth rate of gdp, reducing it from its long term 2% per annum historical trend. When we examine US GDP growth rate data for various periods from 1960 to today, regardless of the period chosen it is apparent that growth rates have been on a steadily declining trend. The straight line in the graph below shows a snapshot of the actual downward trend from 2000 to 2015 projected forward to 2025. The colored bars also illustrate a simple model that assumes the economy has two sectors. One sector has a high productivity growth rate of 3% and the other sector is stalled out with 0% productivity growth rate. To make the numbers fit the data we need to start with the non productive sector at 25% of GDP. This produces a breakdown like that shown, with the non productive sector continually increasing as the overall growth rate declines. These numbers imply that a larger sector of the economy than just energy is contributing to the recent decline in economic growth rate. Increased energy costs account for about a third of the decline by 2015. The other likely contributors to low growth rate are substantial parts of the financial sector, health care and education. This reduced rate of overall economic growth is causing severe economic problems already, with income inequality and stagnant wages. The problems will only get worse if the growth rate continues on its current downward trend. This illustrates that economic growth is a sensitive thing that cannot survive a large part of the economy becoming less productive. This should make it clear that a competitive, lower cost source of clean energy is a necessary condition for an energy transition that does not destroy economic growth. Current wind and solar are currently several times the needed lower cost and are reducing in cost at too low a rate to be an affordable solution for a long, long time. Other approaches like StratoSolar that can solve the problem without destroying the economy deserve some serious attention.
This white paper covers the topic of the reduction in economic growth caused by the increasing cost of energy.
By Edmund Kelly Economist Article: To threaten fossil fuels, solar power must solve its intermittency problem6/28/2015 This article in the Economist paints a reasonably realistic picture of the current state of solar energy. The article is generally positive but points out the economic realities of the problems that still need a solution, particularly intermittency. The current pitch for StratoSolar points out the four problems with current Solar PV that StratoSolar solves: Cost, Intermittency, Storage and Geography.
The Economist focuses on intermittency as the potentially most intractable problem, as the current generally accepted solution to intermittency is to rely on new, large scale, long distance transmission lines and lots of excess clean generation. All of this adds considerable extra expense and politically difficult land use issues for the very large number of new transmission lines. StratoSolar in contrast solves the intermittency problem by being above clouds and weather and thus not being intermittent in the first place. By Edmund Kelly Two recent announcements may indicate that PV supply may be coming into balance with demand. Yingli, the number two PV panel maker is running out of cash after four years of massive losses, and Taiwan Polysilicon Corp, a Taiwan poly-silicon supplier has filed for bankruptcy. This should help bring supply into balance with demand and keep PV panels at current price levels, or higher for a while. If the industry can return to profitability it may result in investment in new plant and equipment that can deploy the backlog of technology improvements that enable progress on the long term PV cost reduction path.
By Edmund Kelly Earth’s cloudy nature is unmistakable in this global cloud fraction map, based on data collected by the Moderate Resolution Imaging Spectroradiometer (MODIS) on the Aqua satellite. While MODIS collects enough data to make a new global map of cloudiness every day, this version of the map shows an average of all of the satellite’s cloud observations between July 2002 and April 2015. Colors range from dark blue (no clouds) to light blue (some clouds) to white (frequent clouds). This NASA site covers things in detail.
Part of the explanation for low ground level solar insolation levels is clouds blocking the sun. This picture from NASA, neatly illustrates the impact of clouds on solar insolation. Most of the world's population is in regions with heavy cloud cover. This includes Europe, China, Asia and North America. This picture also illustrates how truly exceptional California is. Clouds introduce two problems for PV generation. They reduce average insolation which reduces utilization, but perhaps more importantly, they can significantly reduce insolation over long periods lasting weeks. The only current solution to this problem is backup fossil fuel generation capacity of a similar magnitude to PV generation capacity. The developed world already has adequate fossil fuel generation capacity, so the impact is to reduce the utilization of fossil fuel power plants, which at low levels of PV generation is a low cost. However in the developing world, they are adding new generation capacity and so, adding PV in significant amounts will need new matching fossil fuel backup generation. StratoSolar, being above the clouds needs no fossil fuel backup generation, which with high PV market penetration will be a major advantage. However, this benefit is not yet in demand, so it seems StratoSolar suffers from premature timing. Markets don't anticipate. They respond. by Edmund Kelly By Edmund Kelly
This article in next big future highlights the rapid advances in large scale desalination deployment that Israel has led over the last decade. Israel, a country of 8 million people, has gone from a precarious water supply situation to a position today where 50% of its water supply is from desalination and by 2020 it will be 70%. Fortuitously for Israel this has occurred while the Middle East is in the middle of a multi year drought which would otherwise have had a serious economic impact, as has occurred elsewhere in the Middle East. As this recent paper illustrates in detail, reverse osmosis (RO) desalination has been steadily improving and is being deployed on an increasingly large scale worldwide, not just in Israel. The Israeli company IDE is selling water from the latest plant at Sorek for 58 cents a cubic meter. That is about $690/acre-foot, or less than much of the water purchased in California, some of which costs as much as $1,200/acre-foot. As the paper illustrates there are strong prospects for further cost reduction. Reverse osmosis currently consumes about 3kWh of electricity to produce a cubic meter of water. At $0.06/kWh that is $0.18/m3 or about one third of the cost. Providing the energy for desalination from a cheap and sustainable, high utilization source would alleviate a major environmental concern that limits a broader acceptability of desalination, particularly in California. Currently wind and solar alternative energy sources are expensive and worse, have a low utilization. The low utilization means desalination plants would have an equally low utilization. The combination of high cost and low utilization makes desalination powered by current intermittent alternative energy multiple times the cost from fossil fuels. The StratoSolar solution of high utilization PV combined with gravity energy storage provides a cheap, high utilization, clean sustainable source of energy for desalination. Its lower cost over time will help further reduce the cost of clean water. The continuous cost reduction learning curve of RO desalination combined with StratoSolar electricity would reduce water costs to around $0.20/m3 ($230/acre-foot) by the early 2020s. This would make desalination the cheapest and most environmentally friendly source of water, potentially reducing some of the environmental impacts of the current exploitation of natural clean water sources. By Edmund Kelly
This article provides more evidence that the optimistic hopes for rapid growth in world PV installations seem to finally be running up against the economic and practical constraints. China in 2014 is a good example. China's PV goal for 2014 was 14 GW. It now appears actual installations will be about 10 GW (as was predicted earlier). In 2013 the bulk of PV installations in China were large utility scale. In 2014 they wanted to move the bulk to rooftop installations. This was motivated by growing electricity transmission bottlenecks. Rooftop installations don't need new transmission but take longer and are considerably more expensive than large installations. So China was caught between a rock and a hard place. Utility systems mean building lots of expensive long distance transmission that takes years and has political opposition. Rooftop PV is more expensive and less efficient and is also relatively slow to install. Neither option could meet the 14 GW goal. The projections for next year are also for 10 GW. That would be three years in a row at about 10 GW. This just adds one more piece of evidence to the case that none of today's carbon free energy technologies are practical or economically viable alternatives to fossil fuels. This includes wind, solar, hydro, bio and nuclear. All require government support to survive and governments cannot afford to support any or all of them at the significantly higher level needed to displace fossil fuels. The advocates of each technology are happy to take government subsidies and keep tilting at windmills as long as government keeps providing the subsidies. There are attempts at advanced versions of wind, solar and nuclear, but investment levels are miniscule. We are spending over $250B on installing clean technologies that cannot succeed, but investing a tiny fraction of that on R&D for technologies that might succeed. This is especially true for system solutions like Nuclear or large Solar. In part its because government is bad at and should not be involved in picking winners. Finding a structure to finance large scale energy R&D has proved elusive. It would take venture investments at a considerably larger scale than current venture capital funds can support. For a portfolio approach to work a fund would need maybe $100B to invest in maybe 100 ventures over maybe a decade. Given the scale of energy, one success would be enough. This report titled “Beyond Boom and Bust” , was published in April 2012 and I commented on it in this blog post. It was the work of several bodies and individuals, including the Brookings Institute. It argued that US clean energy policy was producing boom and bust cycles, but making no progress in reducing atmospheric CO2. They advocated a more results driven “technology led” policy. The recent EPIA report on PV market outlook for 2014 to 2018 had an interesting section that described the recent behavior of the PV market in Europe as a series of unsynchronized national boom and busts that were hidden by looking at the overall European market statistics. To quote from page 31: PV seems to have always and everywhere followed a path of governments introducing subsidies, investors responding enthusiastically producing a rapid growth boom. Governments then belatedly see the costs mount and reduce subsidies, causing a market bust. Then investor confidence is broken and difficult to restore. Europe has few countries that have not gone through this cycle. Europe has gone from being the biggest PV market to number three or four, with little sign of a likely recovery.
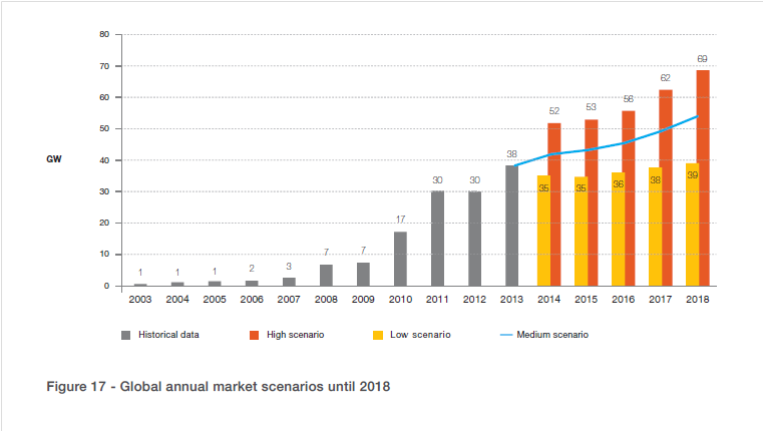
The recent US rapid PV growth is driven by US subsidies enabling profitable investment in PV. The expiration of the Investment Tax Credit in 2016 will burst this bubble, just like all the rest. The governments in Japan and China are early in the subsidy cycle so the boom phase is only building up. In a year or two the costs will be un-sustainable and the bust will inevitably follow. All of this makes it virtually impossible for PV to reduce in cost. Low and unpredictable PV market growth will not encourage investment in newer plant and equipment that can reduce costs. At current cost levels PV market cannot grow without more subsidies. As the boom and bust cycles clearly illustrate, more subsidy is unlikely to be forthcoming. As the “Beyond Boom and Bust” report argued, current US clean energy subsidy policies are not succeeding. They only considered the US, but as we can see, the problem is worldwide. Perhaps it is time to consider the “technology led” policy reforms they advocated. By Edmund Kelly This sixty page report EPIA Global Market Outlook for Photovoltaics 2014-2018 paints a pretty accurate picture of the recent history of the global PV market and has realistic projections for the near term. It has detailed information for each geography and market segment. The graph below from the report shows the near term overall world market projection with optimistic, pessimistic and realistic scenarios. The realistic middle scenario shows slow overall market growth, but no spectacular take off.
The conclusion of the report is a welcome return to reality about the future prospects for PV and a marked contrast to the over optimistic assessments that still seem to pervade the PV business. The central point of the conclusion is that “ The PV market remains in most countries a policy driven market, as shown by the significant market decreases in countries where harmful and retrospective political measures have been taken.” A policy driven market is a euphemism for a subsidy driven market. This lines up with my assessments of the prospects for PV business over the last several years as published in this blog. PV growing at this rate is fine for the PV business, but will not make PV a significant source of electricity anytime soon. It is not sufficient growth to drive costs down, so the business will need subsidy for the foreseeable future. The conclusion of the report backs this assessment as it clearly states that growth is dependent on “sustainable support schemes”. i.e. more subsidies. At some point those that promote current policies in the belief that they will reduce CO2 emissions have to stand back and make a realistic assessment of what they are accomplishing, or more accurately failing to accomplish. By putting all their eggs in the current wind and solar baskets, they are actually precluding investment in possibly better technologies. The psychology seems to be driven by a fear that admitting that current wind and solar are failing, will lead to nothing being done, and something is better than nothing. The reality is that investing only in failure guarantees failure. By Edmund Kelly |
Archives
December 2023
Categories
All
|
||||||||||||
|
© 2024 StratoSolar Inc. All rights reserved.
|
Contact Us
|


 RSS Feed