
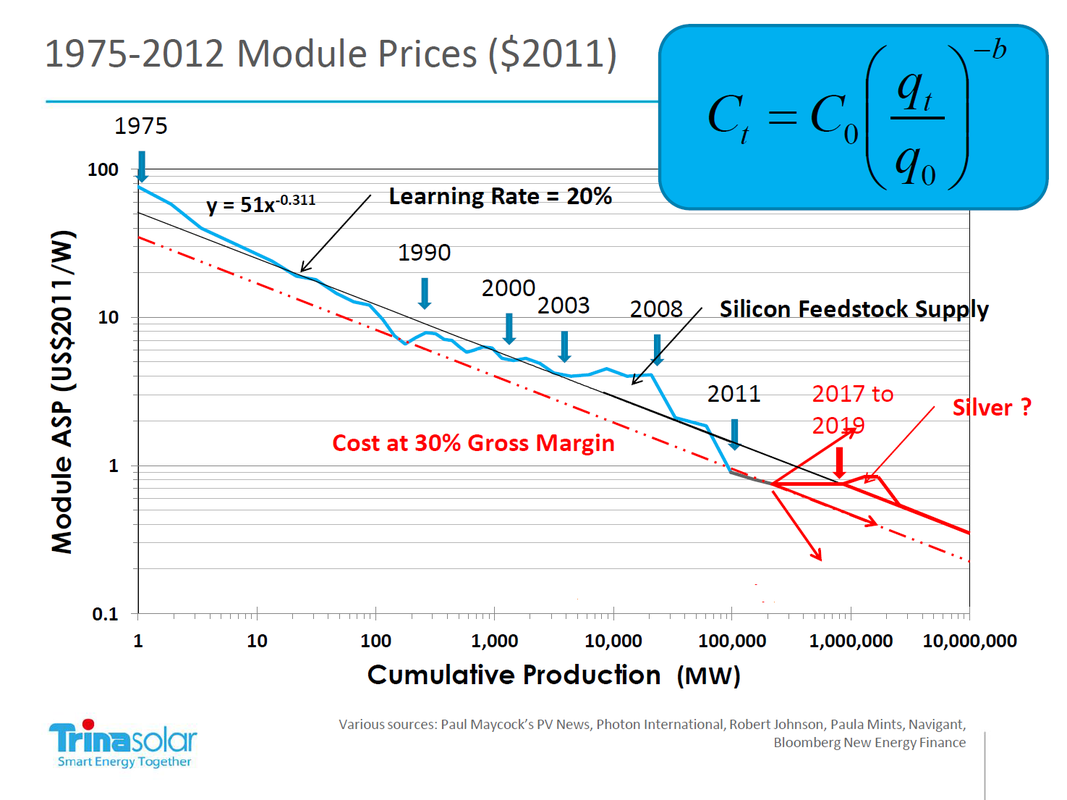
 Trina Solar is the number three PV module manufacturer. This is a Trina graph from a July 2013 conference presentation. This shows the historical 1975-2012 module price history, and Trina's price projection going forward. The various annotations are very informative. The key point is they see module prices staying flat at around $0.70/Wp out until 2019 or 2020. They also see the historical 20% learning rate holding up as the best long term price predictor.
The Trina assessment is realistic, given the need for module manufacturers to restore some profitability. Until this happens they will be unable to attract investment in any significant new more efficient capacity. Long periods of price stability have been a feature of the PV module business. The most recent was the 2000 to 2008 period annotated as "Silicon Feedstock Supply" when a cartel kept polysilicon prices stable at around $400/kg and made huge profits. Polysilicon is now under $20/kg. There are still optimistic PV module price reduction forecasts from Bloomberg, Citibank and PV analysts like NPD Solarbuzz and EPRI, but there seems to be no basis for these assessments other than projecting short term trends foreword without regard for underlying industry fundamentals. Manufacturing costs are continuing to slowly reduce, but the benefits will go to restoring realistic margins from today's unsustainable zero margins. This margin restoration is being enabled by the restoration of a balance between supply and demand as companies like Suntech go under and the Chinese government has stepped in to back stop the industry and cover for the massive reduction in European demand. System costs have room to reduce, especially in residential and commercial markets where soft costs are high. Utility scale PV in the US is below $2/Wp, but with modules firming up at around $0.70/Wp, total utility system costs won't make it below $1.50/Wp for a long time. This is still not competitive without subsidy in the sunniest markets. This means that the market size will still be determined by the scale of subsidies which will have to grow substantially by 2020 to match the projected 30%/year growth rate and 1TWp cumulative installed capacity implied by Trina's graph. All this means that Solar PV is not going to be a significant contributor to global energy for a long time. If this were understood it might encourage investigation of alternatives rather than continued wishful thinking. By Edmund Kelly
Comments
It's a while since I discussed the topic of subsidies. It's a difficult topic to understand, and usually provokes defensive reactions from solar energy supporters.
This recent interview with Shyam Mehta, a GTM PV researcher provides good current information and perspective on the PV business. 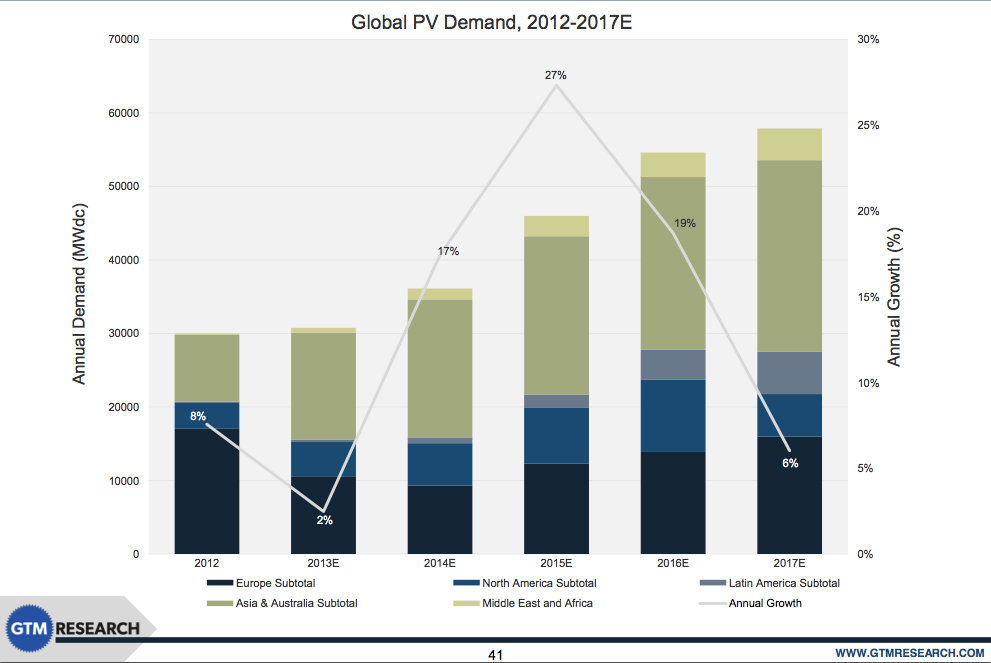
As can be seen from the chart, there were dramatic changes in the composition of PV demand from 2012 to 2013 but no overall growth in volume or revenue. Basically the PV demand went to markets where there were new or growing subsidies and left markets where subsidies declined. Overall, China probably adjusted its subsidies upward mostly to ensure their PV industry survived the drop in European demand driven by the drop in European subsidies.
This is not a well behaved or predictable market. The predictions are totally dependant on predicting subsidies. The GTM forecast is predicting that Europe will regain an appetite for increased subsidies in 2015 and beyond. Its hard to know what the basis for this is. The predicted growth in the US is based on the subsidies that are in place remaining until they diminish in 2016, when US demand is predicted to drop about 50%. The biggest unknown is Asia. Japan's commitment to expanding PV seems pretty solid at least for a few years. China's demand is hard to predict. If it mostly depends on propping up the local PV business they don't have much need to increase demand substantially going forward. Overall it seems a bit optimistic to be predicting an average 20% PV market growth over each of the next two years. Long term, subsidies would be required to grow substantially to maintain a 20% growth rate, which could see prices halve by about 2025, and the cost of subsidies leveling off. A rough estimate of the PV market in 2013 is 30GW, worth about $90B of which $50B is subsidies. If PV prices have stabilized, growth of 20%/y implies growth in subsidies to around $100B in 2017. For the US the 2013 PV numbers are about 4GW installed, worth about $12B, of which about $7B is subsidies. The projected growth implies about $14B in PV subsidies by 2016. That's about the entire alternative energy subsidies in 2013, so it will be noticed. What is the appetite for subsidies? The US spent about $150B from 2008 to 2013, or $30B/y. A lot of that was ARRA one time expenditures. 2014 subsidies are projected to total about $12B. Solar is taking more of the pie. The current US congress would not be predicted to increase alternative energy subsidies, and could easily cut them. This is all rather long winded, but the bottom line is the PV market size is completely defined by subsidies and projecting PV growth means realistically projecting increased subsidies. Given the pain level associated with today’s subsidy levels, (witness Germanys's pullback) its difficult to see significant increases in world total subsidies to the level necessary to sustain substantial PV growth. By Edmund Kelly |
Archives
December 2023
Categories
All
|
 RSS Feed
|
© 2024 StratoSolar Inc. All rights reserved.
|
Contact Us
|