
 Two clean energy narratives have become common refrains. One, that 100% renewables is achievable today and two, that wind and solar generation are cheaper than coal generation. However, we see that world CO2 emissions continue to grow every year and clean energy investment has been stagnant at around $300B/year since 2011. Investment is actually falling substantially in 2019 as China, the largest investor by far is pulling back its subsidy regime. These two narratives do not add up. If solar and wind are cheaper, why are we not switching over? Is it a great conspiracy by the coal, oil and gas industries?
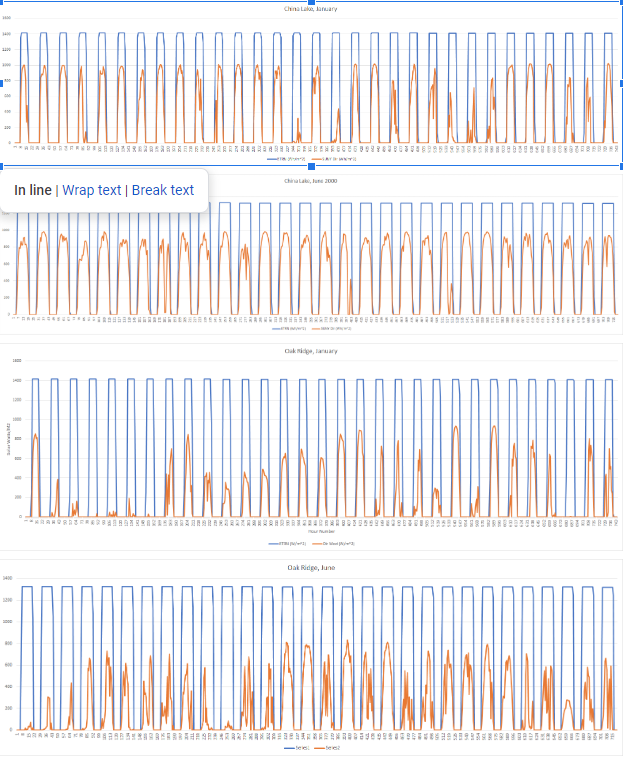
The answer is that neither assertion is what it seems on the surface. It is true that wind and solar generation can have a lower levelized cost of generation (LCOE) than coal generation. However the two forms of generation are not equivalent. Coal generation can be turned on when there is demand. Wind and solar generation only happen when the sun is shining or the wind is blowing and only sometimes lines up with demand. The world operates on energy on demand. As I have written in previous posts, the two large economies with the most clean energy (Germany and California) are facing the problems of intermittent clean energy as it becomes a larger percentage of the total. Energy storage needs to be added to combat intermittency. This exposes the 100% renewables assertion. The 100% renewables goal is aspirational based on continued technological development, not proven available storage technologies. It also either ignores cost or assumes very optimistic cost estimates. Numbers do not clearly represent the nature of the problem with intermittent energy sources which is not visible from simple average energy numbers. A graphical illustration shows the problem better. The graphs above show hourly direct solar insolation in W/m2 for two example US locations, (China Lake CA on top and Oak Ridge TN below) for the months of January and June 2000. The data is from the National Solar Radiation Database 1991–2010. China Lake is in the Mojave desert in California and is among the best solar resources in the US. Oak Ridge is in Tennessee in the US south and is representative of more average US insolation. Any two locations in the US would show the same general intermittency. The yellow lines are terrestrial insolation and the blue lines are StratoSolar. Stratosolar is constant during daylight and zero at night. Terrestrial is far smaller than Stratosolar and far more variable during daylight. The database covers hundreds of locations throughout the US for over a decade. These graphs are only a snapshot of two locations to graphically illustrate the problems with terrestrial solar and the benefits of Stratosolar. Because there is so much data it is very uncommon to show this data graphically. It is usually reduced to daily, monthly or yearly averages. Unfortunately averages do not show the high variability of terrestrial solar and there is no convenient number that captures this variability. January and June are chosen to show the worst and best months. Both locations show reduced insolation and higher variability in January. As the graphs show, even the Mojave desert, one of the best locations in the world has significant variability that even with far beyond daily storage will have power outages. Oak Ridge is more representative of average locations in the US. Here the intermittency in both summer and winter is far beyond what daily storage can handle. Even three days storage would not guarantee the reliability of power. These graphs illustrate the advantages of Stratosolar. The amount of storage to guarantee stable electricity supply is totally predictable. Stratosolar with daily storage is as reliable a source of electricity as coal or natural gas. Stratosolar gravity energy storage is far cheaper than batteries. Also Stratosolar gathers far more energy than terrestrial solar, about 3X at Oak Ridge. These advantages add up to far cheaper electricity than terrestrial solar AND fossil fuels. Intermittency is the Achilles heel of renewable energy that is only slowly being acknowledged. Stratosolar solves that problem and is far cheaper to boot. By Edmund Kelly
Comments
|
Archives
December 2023
Categories
All
|
 RSS Feed
|
© 2024 StratoSolar Inc. All rights reserved.
|
Contact Us
|