|
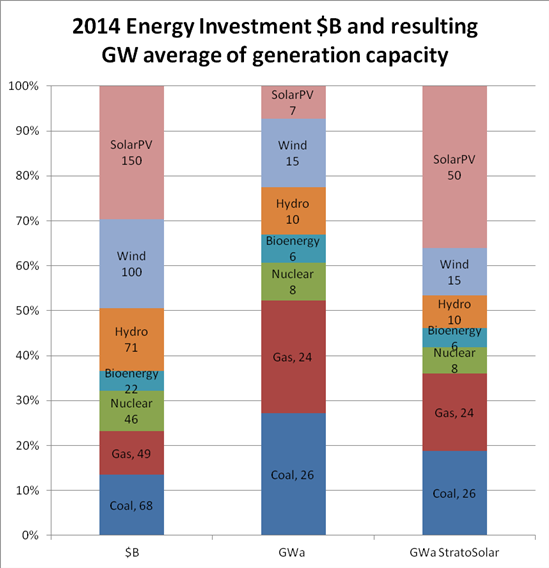
My last post showed the world money spent on Investment in energy generation in 2014 by type of energy. This graph shows this world investment $B and the resulting average generating capacity (in average GW) resulting from that investment.
The $150B spent on Solar PV was about 30% of investment but only around 7% of average generating capacity at 6.9GW. This global perspective shows solar as much worse investment than it is generally portrayed. Solar suffers in two big ways relative to its best case of large utility scale installations in the desert. Only a small fraction of installed GW are in the desert. More are in less sunny climes, like Europe. Another large fraction are more expensive small scale installations on residential and commercial rooftops with lower average utilization factors. These factors will still apply as PV panels improve. If the entire current $506B investment in generation went to StratoSolar it would provide about 140GWa, or the same generation capacity as the current investment in all types of generation. This capacity would produce lower cost electricity than the present because there are no fuel costs, and fixed O&M is a lot lower as well. So at current prices, StratoSolar is a lower cost replacement for current generation. The certainty that PV prices will reduce with growth in cumulative capacity means that the cost of electricity will reliably reduce over time, much like semiconductors have reduced with Moore’s law. By Edmund Kelly
Comments
Back in early 2014, I wrote an article on 2012 energy investment. The primary source of the data was an IEA 2012 report that was trying to project the next 25 years of overall world energy investment by sector. The source for wind and solar investment was a Bloomberg report. The IEA published a more recent projection in its World energy investment outlook 2014 report with more detail, which prompts this update. As with the previous IEA report, the projections for wind and solar investment were very underestimated, $76B for wind and $60B for solar. From Bloomberg’s report on 2014 renewable energy investment, they have wind at $99.5B for 49GW, and solar at $149.6B for 46GW, which I used rather than the IEA projection. All the data has significant error bars, but is sufficiently accurate to see the big picture on energy investment.
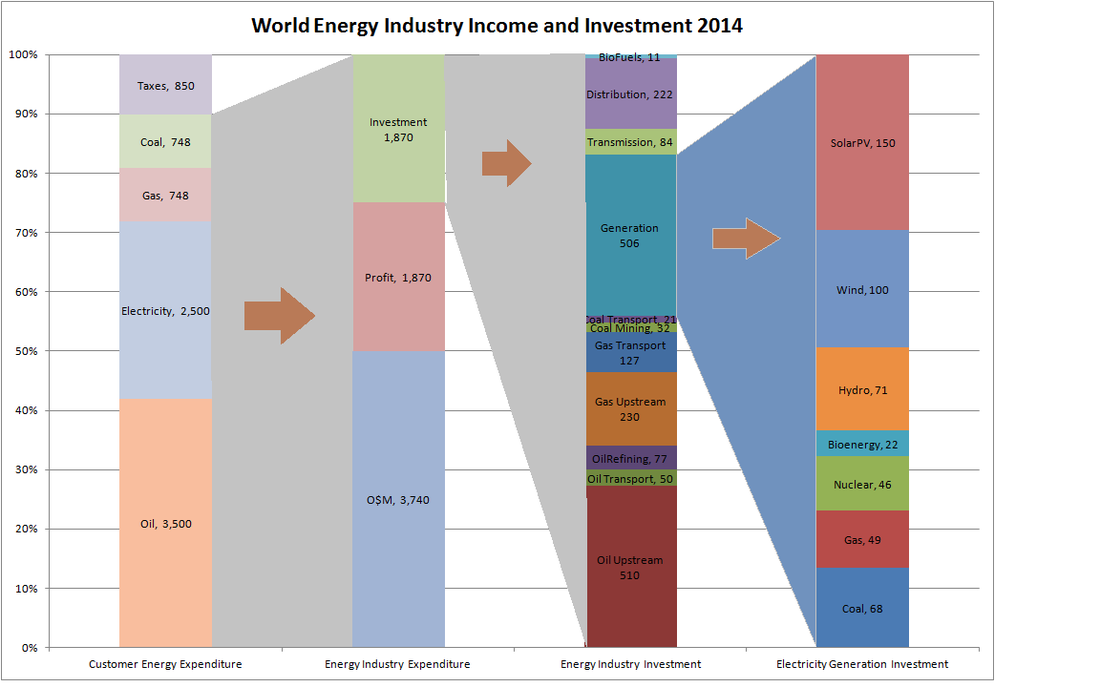
The chart above gathers the information into stacked bar charts. The left most column shows about $8.3T of energy expenditure for customers, both individuals and industry, buying energy. Oil represents fuel at the pump, electricity is metered consumption, coal and gas are fuel used by customers other than electricity generation. Coal is mostly steel and cement production, gas is mostly commercial and residential heating. This expenditure exceeds 10% of 2014 world GDP of about $77T. This expenditure less taxes is the $7.5T revenue for the world energy industry. This industry spends its income on operations and maintenance (about $3.7T), profit (about $1.9T) and investment (about $1.9T). The energy industry investment column shows how this $1.9T of investment is spent. Its roughly 50/50 between oil/gas and electricity generation and distribution, with $506B going to electricity generation. The final right most column shows the breakdown of electricity generation investment. As with my previous article, the scale of wind and solar investment at nearly $250B is larger than coal, gas, nuclear and hydro investment. This chart is a rare collection of financial data on energy. There is lots of data on energy generation and consumption but not so much on the money associated with the energy. Deep throat’s advice to ”follow the money” is the best way to understand the forces that are driving the decisions that are actually increasing CO2 emissions while spending a great deal on trying to reduce them. Fundamentally economics drive politics. Politics, under pressure has come up with support for a very large investment in wind and solar, more than all other energy technologies combined. At some point the political awareness of the in-effectiveness of this expenditure has to become apparent. Unfortunately the debate is so polarized that even bringing up this topic is seen as being anti clean energy when in fact it is the most pro clean energy position to take if actual CO2 emissions reductions is your goal. The numbers indicate we are spending a lot on clean energy without much result. To continue this path we need to spend a lot more, which is the conventional policy driven view. Politically where is this money going to come from? Expenditure on clean energy has been flat for five years. Perhaps the coming world economic slowdown will focus attention on trying to solve the problem with the limited though large financial resources available By Edmund Kelly |
Archives
December 2023
Categories
All
|
|
© 2024 StratoSolar Inc. All rights reserved.
|
Contact Us
|


 RSS Feed