
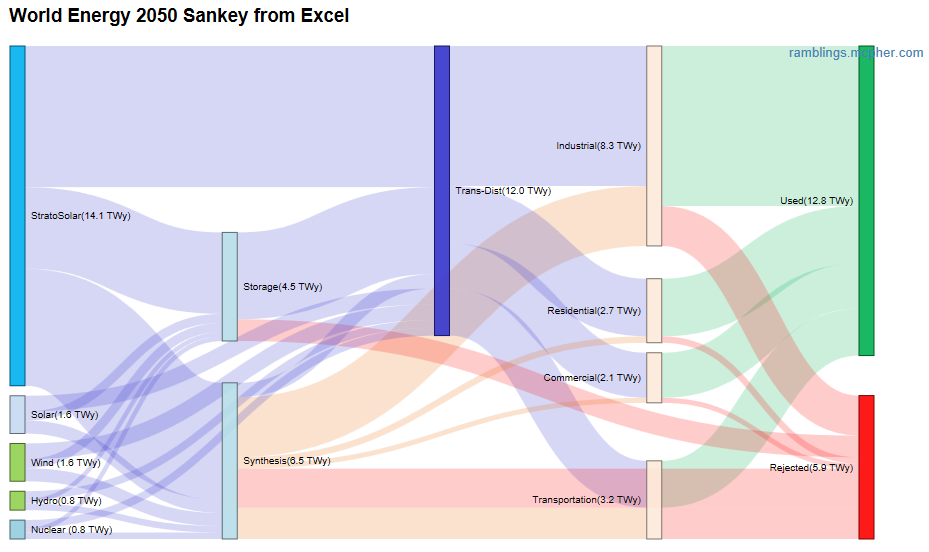
 A Sankey diagram like the one above of possible fossil fuel free world energy system is informative. The biggest benefit of such diagrams is that they show all the major elements of an energy system in a quantitative manner along with their relationship to each other. Advocates for intermittent alternative energy sources focus on generation and rarely take an overall energy system view. The perspective is that the energy system should adapt to their needs and somehow this will not cost anything. As the diagram above shows, intermittent electricity based energy systems will clearly need a lot more transmission and distribution. They also need some mix of energy storage and fuel synthesis. Historically, opponents of alternative energy used such system perspectives to denigrate alternative energy as too far from reality to ever be practical. However, as wind and solar have grown into the mainstream their advocates still shy away from such analysis. When they do it is superficial, like the WWS proposals from Stanford. This diagram above focuses on StratoSolar as the main source, but any of the other sources could replace it as it shows energy produced and consumed, not generation capacity. If the main source were nuclear, storage could be reduced considerably, but the rest would remain the same. The diagram contains more information than the LLNL diagram in the previous post. The boxes are scaled, not just the flows, and the units are TWy which show both average electricity generation as well as yearly energy use. In the online version, the flow magnitudes are also visible. Its simple to turn the energy flows shown into $ costs. In an electricity based energy system there are no variable fuel costs and capital costs dominate. Each block (except for used and rejected) represent capital costs. To get a sense of the costs involved for each of the blocks on the energy supply side in the diagram, all that is needed is the energy flow from the diagram, a capacity factor and a $/W capital cost. The capacity factor enables the calculation of the nameplate capacity needed and the $W can calculate capital cost from nameplate capacity. This capital cost along with efficiency, fixed O&M and working cost of capital can then give a $/kWh contribution of each block to the cost of energy on the consuming side. 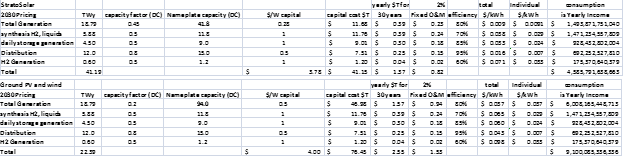 These 2 tables show these calculations using StratoSolar and Ground PV capacity factors and PV $/W cost assumptions for 2030 of $0.50/W, or less than half today’s cost. They also show estimates of these factors for storage, synthesis and Transmission/Distribution. Of the blocks, the $/W cost of storage is the biggest unknown. Synthesis and Transmission/Distribution rely on scaling well proven technologies.
For StratoSolar, yearly capital expenditure + fixed O&M adds up to about $2.5T. Adding profit and other costs makes energy system income about $4.6T or an energy expenditure of $4.6T. For comparison, energy expenditure today is about $6.5T. The cost of generation is the root of other energy costs. StratoSolar generation is $0.009/kWh. Synthesis is .029/kWh. Adding these gives a fuel cost of $0.038/kWh. This translates to about $1.5/kg of H2 or a gallon of liquid fuel. Storage costs $0.024/kWh. Adding electricity in gives the cost of electricity from storage as $0.033/kWh. Ground solar generation is about 4X this cost based on the same PV technology, or $0.037/kWh. This gives a fuel cost of $0.065/kWh or $2.60/kg. Electricity from storage is $0.060/kWh. Yearly world consumption is $9.2T. Though the StratoSolar costs are much lower than ground PV, either of these solutions would probably be acceptable by 2050. However, ground PV is a decade or more away from matching fossil fuels while StratoSolar beats fossil fuels by at least a factor of two at today's PV prices, producing electricity at a cost of about $0.016/kWh. StratoSolar's pricing is based on putting today’s PV in a better place with 4X more output for the same capital cost. As PV capital costs have fallen rapidly in the last few years with rapid PV panel price reduction to below $0.40/W, StratoSolar estimates for electricity costs have fallen rapidly as well. StratoSolar generation is now much cheaper than the cheapest fossil fuel generated electricity. As the analysis above shows an energy system based on intermittent sources is practical and affordable. The enabling element is generation that is much cheaper than fossil fuel generation. StratoSolar provides this missing element. By Edmund Kelly
Comments
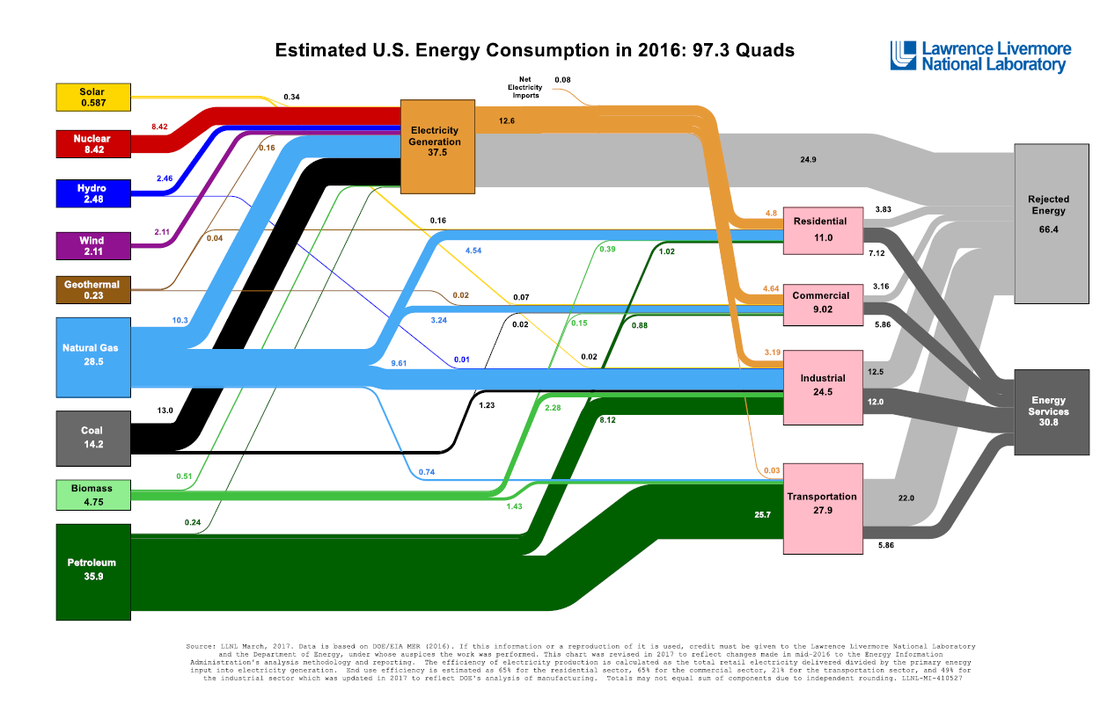 Lawrence Livermore National Laboratory have published a Sankey Diagram of US energy Consumption for many years. The most recent update shown above is for 2016. This shows the US energy flows in a quantitative manner using the width to show the size of each flow. The boxes are not scaled. To describe what this diagram shows in words would be very verbose and very difficult to understand. It captures a lot of data and presents it in a form that helps in understanding. It shows the sources of energy on the left and the consumers of energy on the right. The extreme right shows the amount of consumption that does useful work and the amount that is rejected through inefficiency.
Even a quick perusal is very informative. The production side is dominated by fossil fuels. Natural gas is now twice as big as coal which has been the biggest change in recent years. The overall system is very inefficient with over two thirds of energy rejected. Electricity generation and transportation are the worst culprits. Solar is still tiny and wind is not much bigger. This diagram only shows the US which is about 20% of world energy. On both a US and a world-wide basis more money is now invested in solar and wind generation than all the other sources of electricity generation combined. This shows that this investment is not supplying a noticeable amount of energy. The purpose of wind and solar is to eventually replace fossil fuels. This chart shows how far we are from achieving that goal. World investment in wind and solar has been a constant $250B for the last five years, half the total investment in generation of about $500B. It is currently on a downswing, dropping 17% in Q1 2017. There is no indication of a likely increase in the near future. Wind and solar economics are steadily improving, but the rate is insufficient to make a dent in the problem they are meant to solve. The emperor has no clothes. StratoSolar could make solar an effective solution that could realistically achieve a fossil fuel free energy system in a timeframe that can limit CO2 to 450 ppm. Current solar will not succeed in a timely enough manner to limit CO2 to acceptable levels. The time for wishful thinking is past. By Edmund Kelly |
Archives
December 2023
Categories
All
|
 RSS Feed
|
© 2024 StratoSolar Inc. All rights reserved.
|
Contact Us
|