
|
In june 2013 I published a blog post that contained a video focused on how to reduce world CO2 emissions from fossil fuels to zero by 2050. There has been a lot of publicity recently prompted by the release of the latest IPCC report on global warming. The IPCC keeps ratcheting up the pressure from the constantly accumulating evidence for the damage of climate change both today and projected forward into the increasingly near future. This focus at the end of another year seems a good time to revisit the primary motivation for Stratosolar. The central theme of Stratosolar is that the only viable solution to CO2 emissions reduction is clean energy that is a complete 100% replacement for fossil fuels that is significantly cheaper. Stratosolar is such a solution and current wind and solar are not.
Back in 2013 annual CO2 emissions were about 32 Gt/y. In 2018 they have increased to about 42 Gt/y, pretty much what was predicted by business as usual. There is a lot of publicity around wind and solar, but as yet they clearly have had little effect on CO2 emissions as we continue to accelerate our march towards climate armageddon. The 2013 video sets a goal of roughly 1 TWy average yearly reduction in fossil fuels to get to zero CO2 emissions between 2020 and 2050. That is still the goal but ramping production of sufficient replacement technology by 2020 is not realistic. To meet the 2050 goal and keep temperature rise below 1.5 to 2 degrees C will need a more aggressive ramp the later we start. Despite an increasing acceptance of the reality of climate change, the cost, complexity and uncertainty of clean energy solutions means adoption is low and driven mostly by government subsidies and mandates in rich developed countries. Most growth in CO2 emissions is in countries that are not the US, Europe and China. Paradoxically the US is the only player to actually reduce emissions. This has been due to cheap gas replacing coal. Wind and solar growth barely compensate for reduced nuclear. To get a perspective, todays approximately 100 GW/y of new nameplate solar is about 25GW/y of average generation. The goal is 1TW/y of average new generation. That's a factor of 40. If we split the demand evenly between wind and solar its about a factor of 20 each. That is just the generation. It does not count the storage and backup generation to achieve 100% renewable energy which are at least as much again. Currently we are spending about $250B on wind and solar. 40 times 250 is $10T/y. That cost is about 10 times current world investment in all energy infrastructure. Costs have to reduce by a factor of ten at least to fit current world energy budgets. That level of cost reduction in the relatively short time available is highly unlikely. Stratosolar eliminates the backup costs and reduces the generation cost by more than three on average, making costs within a viable range with historic cost reduction. 2TW/y of new Stratosolar at $0.75/W is $1.5T/y which is economically compatible with current levels of investment. As the IPCC shows, we are not on a path to success and time is running out It's time to evaluate what are seen as risky alternatives like Stratosolar. By Edmund Kelly
Comments
Its interesting that the two major alternatives to fossil fuel energy (wind+ solar and nuclear) are mostly at odds with each other. In the debate, they both point out the weaknesses of the other, and to an objective outsider clearly paint a picture where neither is a viable solution. The problems with cost overruns on new nuclear plants in the US and Europe have sharpened the debate recently with Toshiba’s announcement of massive losses from its Westinghouse division. The pointers at the bottom below show three perspectives on Toshiba’s woes.
My most recent blog posts have focused on the problems with intermittent wind and solar. Nuclear clearly has its problems too. Toshiba’s and others (Areva) problems at minimum show how hard current nuclear is, without even getting to how it could be modified to be more sustainable and load follow. With reactors being shut down in Europe, the US and Japan and cost overruns leading to no new orders, nuclear is not going anywhere. China is the only country adding any significant nuclear capacity. This would seem to end what had been seen as the beginnings of a nuclear revival. Most nuclear advocacy centers on new designs to remedy problems with current reactors. Nuclear takes a long time from experimental to demonstration to production power plants. Minimally the sequence takes decades and costs billions to tens of billions of dollars. So, nuclear power and wind and solar face similar problems. Neither are viable replacements for fossil fuels and it will take significant development of new unproven technologies to make them so. Compare this with StratoSolar. Much of StratoSolar is just today's PV. The unproven parts are relatively simple engineering based on existing mass produced technologies. To follow the nuclear model, the first step is to build an experimental platform. This could be done in less than a year for a few million dollars. An experimental nuclear reactor is many years and hundreds of millions of dollars. Relative to a new nuclear reactor, StratoSolar demonstration and production platform steps are equally as fast and low cost as the experimental platform. The point is that StratoSolar is no more speculative than wind, solar and nuclear, when the development paths of each that lead to viability are objectively analyzed. The perspective that wind, solar and nuclear are all unproven and speculative is not the perspective of their advocates. Wishful thinking rules the day. Recently Bill Gates led the founding of Breakthrough Energy Ventures (BEV), a fund to invest in long term energy ventures. Given Bill Gates fondness for nuclear power, funding nuclear power is probably the focus of the fund. Given the funding required to get to production plants, its very unlikely that a private fund could raise the tens of billions required even to develop one new plant. Presumably the plan is to fund the earlier cheaper development stages and persuade governments to foot the major bills. Perhaps we can persuade BEV to fund StratoSolar? It might be high risk but its cheap and fast. Its actually a typical venture funded opportunity. By Edmund Kelly Rod Adams: reporter http://www.theenergycollective.com/rodadams/2398838/toshiba-announces-6-3b-writedown-229m-construction-company-acquisition Jim Green: Friends of the earth: http://www.theenergycollective.com/energy-post/2399091/nuclear-safety-undermines-nuclear-economics Michael Schellenberger: The breakthrough institute http://www.theenergycollective.com/shellenberger/2398737/nuclear-industry-must-change-die 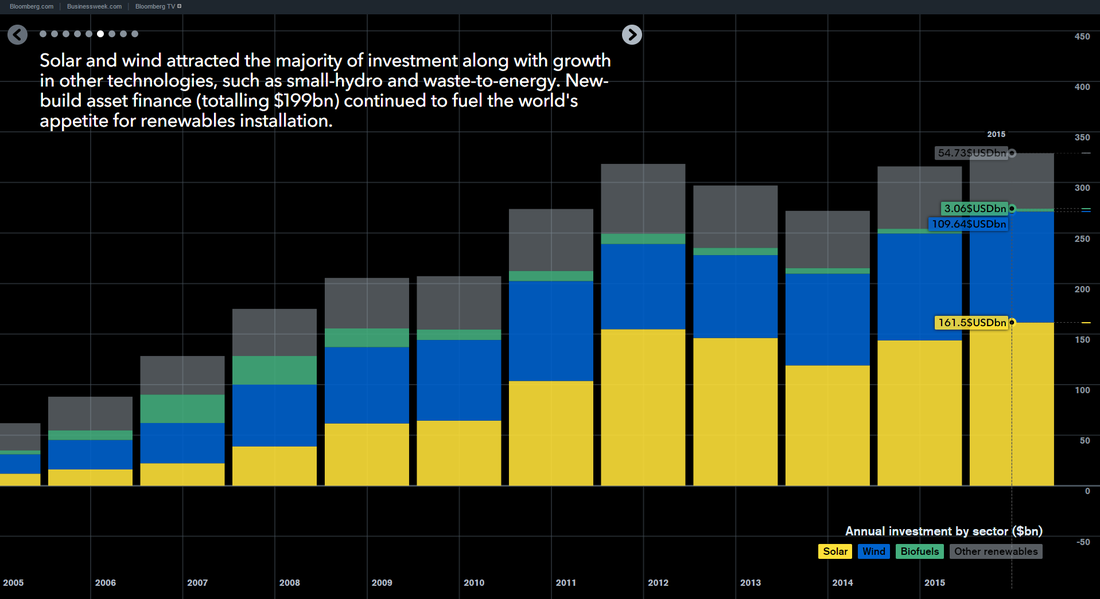 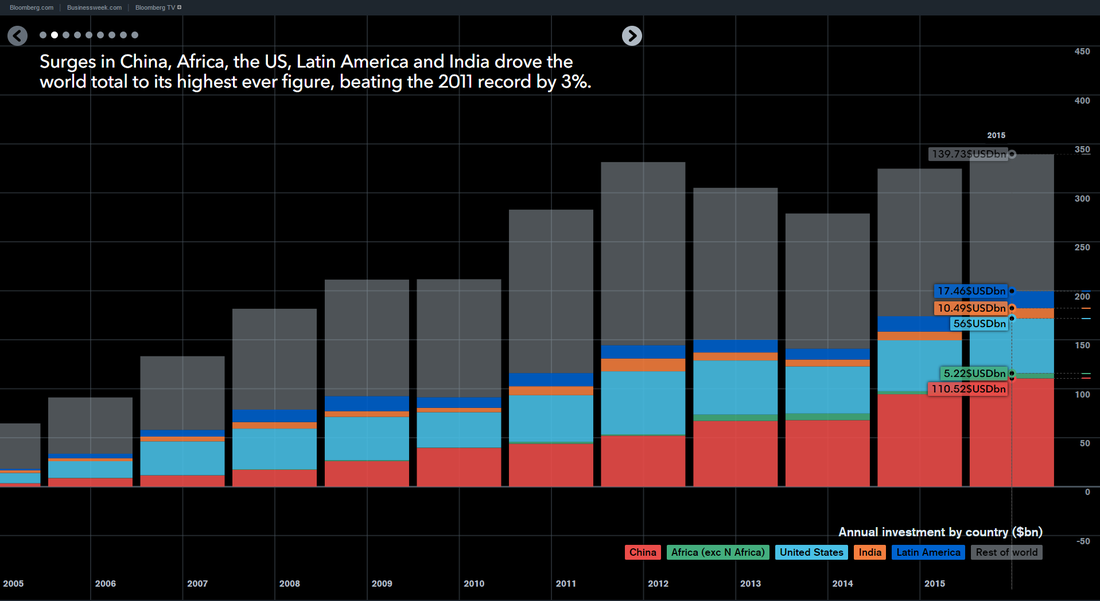 Bloomberg came out with a 2015 update to their report on world investment in clean energy. Above are a couple of charts showing the overall investment by type and by region. Total investment rose slightly (3%) over 2014 to $328B of which $161.5B or 50% went to solar. The overall investment level has not changed significantly for the five years, 2011 to 2015. Over this period solar has stayed about the same percentage of clean energy investment. Annual solar capacity has grown from 25GW to over 50GW, so the average cost of solar has dropped significantly from about $6.40/W($161/25) to $3.20/W($161/50), moving solar closer to wind in cost. PV panel costs have not declined much over this period ( after a dramatic decline around 2011) so most of the solar cost reduction has been from the rest of the system. The rate of these system cost reductions is slowing. The overall world average cost covers a very wide range of systems, from high cost rooftops over $6.00/W to very large utility arrays at less than $1.50/W, along with large regional differences in labour and regulatory costs. As the regional market chart shows, there has been a significant change in where the investments are taking place over the five years. The two biggest trends were the decline of Europe and the rise of China. Without China’s decision to dramatically increase its clean energy investment in 2014 and 2015, the overall market would have declined every year from 2011. Despite dramatic reductions in price, investment in solar has hardly increased. This tells us that solar investment is not yet driven by market forces. The price will have to fall substantially from current levels for solar to become market competitive. Overall the charts present a picture of a stagnant clean energy market. Given the need for government support to maintain the market, the world economic slowdown does not bode well for growth in the clean energy market, particularly in China. Despite its greater than $300B/y size, the current clean energy market is not reducing CO2 emissions by any noticeable amount. Based on these charts it is not on a path to do any better. There is a need for a change. StratoSolar makes today's PV a practical replacement for fossil fuels. Its an incremental improvement of PV, not a dramatic revolutionary new technology. It is easy, quick and cheap to prove its viability. The path we are on is clearly not working. It is worth giving StratoSolar a try. By Edmund Kelly The attached white paper is a more comprehensive look at the impact of higher energy costs on reducing GDP growth. This tells us two things. First, we are in serious economic trouble already with a low and declining rate of economic growth from the continually increasing cost of fossil fuels. Second, replacing fossil fuels with more expensive alternative energy sources will only make the problem worse. So far, wind and solar have been a relatively small economic factor, but growth to a level where they can contribute to a significant reduction in CO2 emissions would quickly get us into economic decline, and the political unrest that comes with economic decline. StratoSolar's lower cost of energy production than fossil fuels can reverse the current decline in the rate of economic growth by making energy cheaper on a continuing basis. By Edmund Kelly
An argument against large scale deployment of alternative energy is the negative impact of the higher cost on gdp growth. The following is an attempt to quantify this effect based on the increasing cost of energy since around 1970. The modern world is based on sustained economic growth. As the chart below shows, US real gdp per capita has maintained an overall 2% per annum growth rate through depression, recessions and two world wars. This has been possible because of technological advances increasing the productivity of all economic sectors. Since around 1970, the cost of producing energy has steadily risen. Initially this was driven by the increasing cost of oil production, and more recently the cost of expensive alternative energy production has also become a significant factor. Energy is a significant part of gdp, so its share growing from around 5% to around 10% of gdp should clearly have been a drag on the growth rate of gdp, reducing it from its long term 2% per annum historical trend. 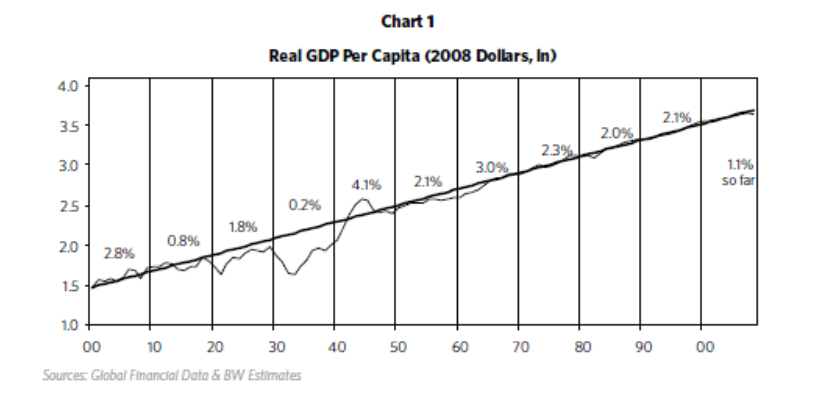 When we examine US GDP growth rate data for various periods from 1960 to today, regardless of the period chosen it is apparent that growth rates have been on a steadily declining trend. The straight line in the graph below shows a snapshot of the actual downward trend from 2000 to 2015 projected forward to 2025. The colored bars also illustrate a simple model that assumes the economy has two sectors. One sector has a high productivity growth rate of 3% and the other sector is stalled out with 0% productivity growth rate. To make the numbers fit the data we need to start with the non productive sector at 25% of GDP. This produces a breakdown like that shown, with the non productive sector continually increasing as the overall growth rate declines. These numbers imply that a larger sector of the economy than just energy is contributing to the recent decline in economic growth rate. Increased energy costs account for about a third of the decline by 2015. The other likely contributors to low growth rate are substantial parts of the financial sector, health care and education. This reduced rate of overall economic growth is causing severe economic problems already, with income inequality and stagnant wages. The problems will only get worse if the growth rate continues on its current downward trend. This illustrates that economic growth is a sensitive thing that cannot survive a large part of the economy becoming less productive. This should make it clear that a competitive, lower cost source of clean energy is a necessary condition for an energy transition that does not destroy economic growth. Current wind and solar are currently several times the needed lower cost and are reducing in cost at too low a rate to be an affordable solution for a long, long time. Other approaches like StratoSolar that can solve the problem without destroying the economy deserve some serious attention. 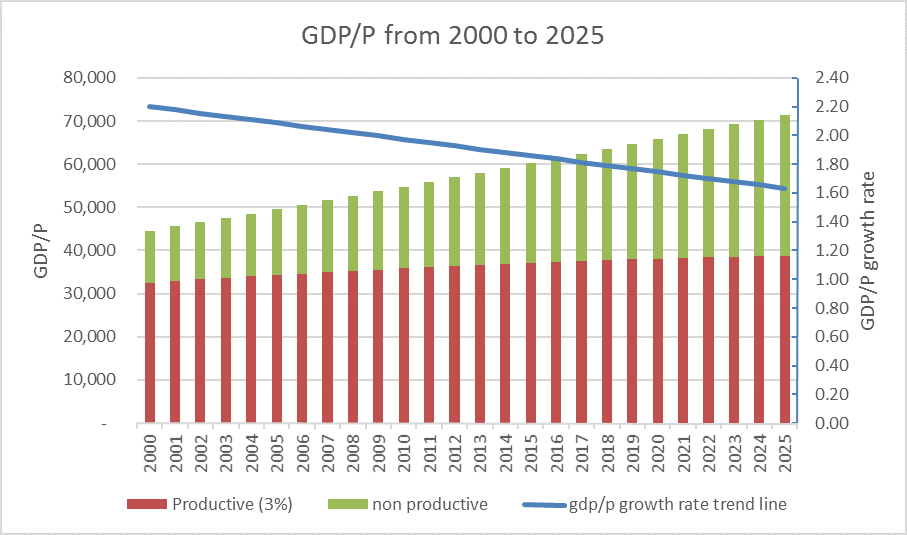
This white paper covers the topic of the reduction in economic growth caused by the increasing cost of energy.
By Edmund Kelly 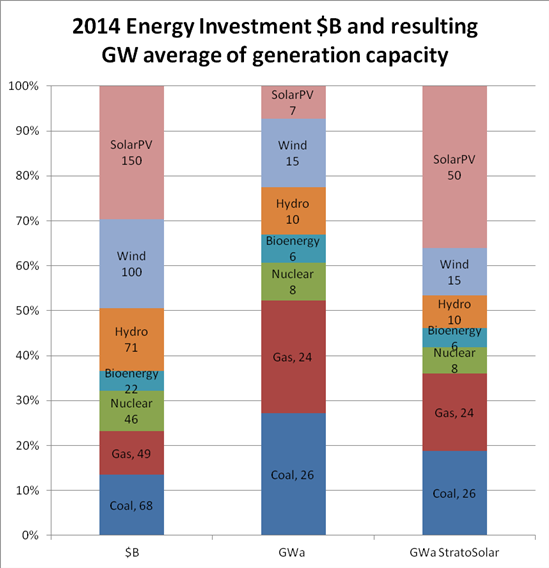 My last post showed the world money spent on Investment in energy generation in 2014 by type of energy. This graph shows this world investment $B and the resulting average generating capacity (in average GW) resulting from that investment.
The $150B spent on Solar PV was about 30% of investment but only around 7% of average generating capacity at 6.9GW. This global perspective shows solar as much worse investment than it is generally portrayed. Solar suffers in two big ways relative to its best case of large utility scale installations in the desert. Only a small fraction of installed GW are in the desert. More are in less sunny climes, like Europe. Another large fraction are more expensive small scale installations on residential and commercial rooftops with lower average utilization factors. These factors will still apply as PV panels improve. If the entire current $506B investment in generation went to StratoSolar it would provide about 140GWa, or the same generation capacity as the current investment in all types of generation. This capacity would produce lower cost electricity than the present because there are no fuel costs, and fixed O&M is a lot lower as well. So at current prices, StratoSolar is a lower cost replacement for current generation. The certainty that PV prices will reduce with growth in cumulative capacity means that the cost of electricity will reliably reduce over time, much like semiconductors have reduced with Moore’s law. By Edmund Kelly 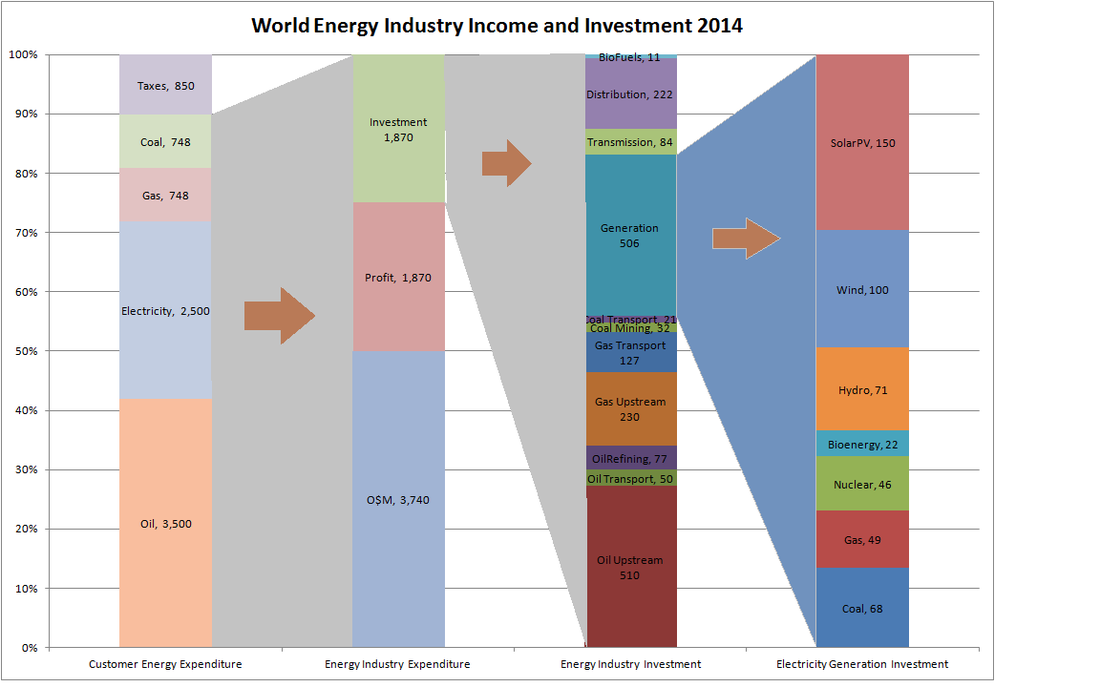 Back in early 2014, I wrote an article on 2012 energy investment. The primary source of the data was an IEA 2012 report that was trying to project the next 25 years of overall world energy investment by sector. The source for wind and solar investment was a Bloomberg report. The IEA published a more recent projection in its World energy investment outlook 2014 report with more detail, which prompts this update. As with the previous IEA report, the projections for wind and solar investment were very underestimated, $76B for wind and $60B for solar. From Bloomberg’s report on 2014 renewable energy investment, they have wind at $99.5B for 49GW, and solar at $149.6B for 46GW, which I used rather than the IEA projection. All the data has significant error bars, but is sufficiently accurate to see the big picture on energy investment.
The chart above gathers the information into stacked bar charts. The left most column shows about $8.3T of energy expenditure for customers, both individuals and industry, buying energy. Oil represents fuel at the pump, electricity is metered consumption, coal and gas are fuel used by customers other than electricity generation. Coal is mostly steel and cement production, gas is mostly commercial and residential heating. This expenditure exceeds 10% of 2014 world GDP of about $77T. This expenditure less taxes is the $7.5T revenue for the world energy industry. This industry spends its income on operations and maintenance (about $3.7T), profit (about $1.9T) and investment (about $1.9T). The energy industry investment column shows how this $1.9T of investment is spent. Its roughly 50/50 between oil/gas and electricity generation and distribution, with $506B going to electricity generation. The final right most column shows the breakdown of electricity generation investment. As with my previous article, the scale of wind and solar investment at nearly $250B is larger than coal, gas, nuclear and hydro investment. This chart is a rare collection of financial data on energy. There is lots of data on energy generation and consumption but not so much on the money associated with the energy. Deep throat’s advice to ”follow the money” is the best way to understand the forces that are driving the decisions that are actually increasing CO2 emissions while spending a great deal on trying to reduce them. Fundamentally economics drive politics. Politics, under pressure has come up with support for a very large investment in wind and solar, more than all other energy technologies combined. At some point the political awareness of the in-effectiveness of this expenditure has to become apparent. Unfortunately the debate is so polarized that even bringing up this topic is seen as being anti clean energy when in fact it is the most pro clean energy position to take if actual CO2 emissions reductions is your goal. The numbers indicate we are spending a lot on clean energy without much result. To continue this path we need to spend a lot more, which is the conventional policy driven view. Politically where is this money going to come from? Expenditure on clean energy has been flat for five years. Perhaps the coming world economic slowdown will focus attention on trying to solve the problem with the limited though large financial resources available By Edmund Kelly  I last discussed the slowdown in world investment in clean energy in this blog post from January 2014. This article discusses the drop in clean energy investment so far this year (2015) compared to last year (2014) based on data from a recent Bloomberg report. This shows the slowdown continues. The graph above shows total world investment in clean energy, mostly wind and solar from 2004 to 2015 (estimated)and clearly illustrates this slowdown in investment.
Numbers are numbing and hard to put in context. This graph shows two big things. Firstly clean energy investment has been relatively flat for five years since 2011. There are no indications that it will rise from this level. To put things in perspective, $250B/y to $300B/y is a lot of money and exceeds all other investment in electricity generation. That includes investment in coal, gas and nuclear power plants. It should also be remembered that about half of this investment is various government subsidies Secondly, when we look at the generating nameplate capacity this $250B buys, it is about 100GW of wind and solar, with an average generation of about 20GW/y. To reduce CO2 emissions in a timely manner we need to add at least 500GW of clean new average generation capacity every year. 20GW is a factor of 25 too small. The rapid drop in solar costs since 2011 have created an illusion that solar costs will continue to fall at rapid rates and enable exponential growth. The reality is that PV panel prices stabilized years ago. Other system costs have reduced rapidly, but the bulk of the rapid cost reductions are over. There is no way that current wind and solar will ever provide sufficient capacity within the current budget based on their projected costs. A change in strategy is needed. StratoSolar at current costs would provide over 100GW/y of average generation for $250B and as a complete lowest cost solution could competitively replace other new generation to provide over 200GW within the current world spending on generation. Eventually, at less than the current investment level in energy of $1.5T/y, StratoSolar could provide all energy without the world spending any more on energy than it currently does. This is a strategy that could succeed. By Edmund Kelly |
Archives
December 2023
Categories
All
|
||||
 RSS Feed
|
© 2024 StratoSolar Inc. All rights reserved.
|
Contact Us
|