
|
This recent article in the New York times provides a visual representation of electricity generation by source of energy from 2000 to 2022 for all countries. The article is based on data from Ember.
The data shows that world electricity generation has about doubled over this period from 15,000 TWh to 30,000TWh. Generation in the US and Europe has been almost constant during this 22 year period, though the energy sources have shifted away from coal to mostly gas and some renewables. World growth has been from China and other developing economies. China went from 1,200 TWH in 2000 to 8,500 TWh in 2022, about one third of world electricity generation, while the US, Europe and the developed world electricity consumption hardly grew at all. Some of the stability in the developed world was due to the transfer of much energy intensive manufacturing to China. China added 210 GW of new solar PV in 2023 which sounds like a lot but relative to China’s total generation capacity of over 2 TW wind and solar are only about 12% of generation. China has problems with coordinating its provision of electricity transmission and distribution for intermittent sources but is still far short of the 25% or so limit for fossil fuel backed solar and wind generation. No major electricity system has yet to get to this scale, where energy storage becomes a requirement for additional growth. Storage so far is used to stabilize grids from the rapid fluctuations introduced by intermittent renewable sources as with the California “duck curve”. The recent COP28 and previous political agreements clearly demonstrate that the central issue with energy is economics. Activists like to claim that renewables are economically viable but the sad fact is that even with cheap PV panels and windmills, intermittent renewables already significantly increase electricity prices to consumers and prices will only continue to increase at a faster rate as necessary storage and grid upgrades are added. Stratosolar offers a path to solar electricity at one fifth to one tenth the price of ground solar at a scale necessary to eliminate fossil fuels. It could be deployed rapidly at scale in time to mitigate the effects of increasing CO2 from fossil fuels. Its low cost enables replacement of ALL fossil fuel use, not just current electricity generation. By Edmund Kelly
Comments
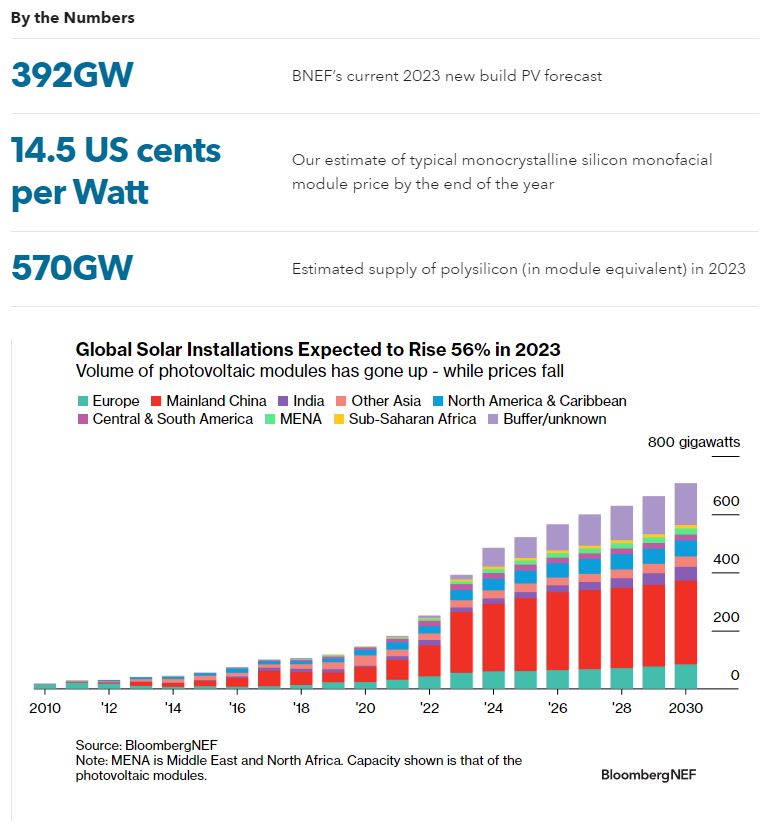 Bloomberg’s latest 2023 data for PV.
This graph shows a sudden large jump in global PV growth for 2023 from 2022, which itself was a big growth from 2021. Nearly all this new growth is from China. From the graph, China’s 2023 installations are projected at around 210GW (around ten times the US). If this rate is sustained to 2030 as shown, this will be over a cumulative 2 TW between 2023 and 2030. This graph is for DC nameplate gigawatts. PV has a lower capacity factor than fossil fuel plants so this is more equivalent to 1TW of equivalent fossil fuel generating nameplate capacity. China’s current total nameplate electricity generating capacity is less than 2TW. This would put solar alone at about 50% of total generating capacity by 2030. China currently backs up solar and wind with coal. The ability to add solar backed up by coal will stop long before this 2030 projection. To manage this level of solar will require very significant electricity storage, on the order of hundreds of GW. China is investing heavily in battery manufacturing capacity so this may end up working out. China has clearly made a strategic choice to try and reduce its dependence on fossil fuels, particularly oil where it is totally dependent on imports. It controls about 90% of global PV panel manufacturing capacity, all of which is contained within China. They have also made massive commitments to long distance HVDC transmission and have much reduced regulatory impediments. The US is vocal about the clean energy transition, but the reality is that over the last decade China invested in renewables while the US invested a lot more $T in Fracking and fossil fuels. If China maintains this projection, Its electricity could end up very low in fossil fuel consumption by 2030. It will also be much more energy secure, which is probably the main incentive. Europe and the US are on much slower and erratic energy transition timetables. By Edmund Kelly 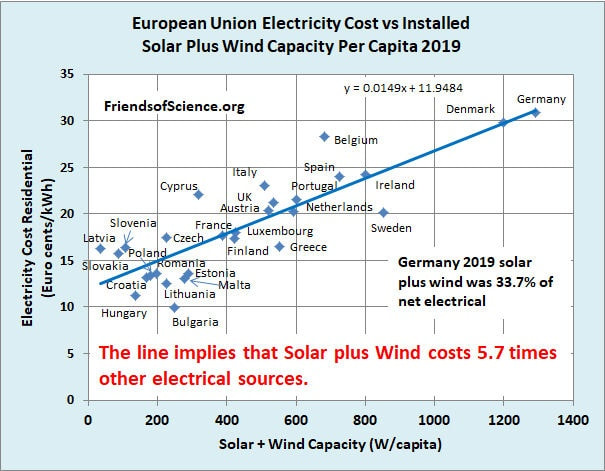 This graph shows the price of electricity in 2019 across the EU. The vertical axis is price in cents/kWh. the horizontal axis shows installed wind and solar capacity in watts per person. As the installed capacity per person increases, the price increases. The value in this graph is the number of countries makes for a statistically large sample. This makes it harder to refute the reality that while wind and solar provide low cost electricity to grid operators, the additional costs of operating the grid with intermittent sources make electricity much more expensive to provide to consumers. In previous posts I have attributed the bulk of these additional costs to reduced overall grid capacity factor as the bulk of electricity costs are from capital costs.
Germany and Denmark have the highest installed wind and solar capacity and the highest priced electricity, at least 3X the countries with the lowest installed wind and solar capacity. As more capacity is added, additional investment in storage and transmission will add additional costs and instead of a straight line price will rise non linearly. These high prices are already causing pain but are sustainable because electricity only provides a fraction of total energy in rich countries. In a future where the bulk of energy will come from electricity the overall cost to consumers will increase significantly and will not be sustainable even in the richest countries and definitely not in the bulk of the developing world where most of the growth in energy is concentrated. By Edmund Kelly 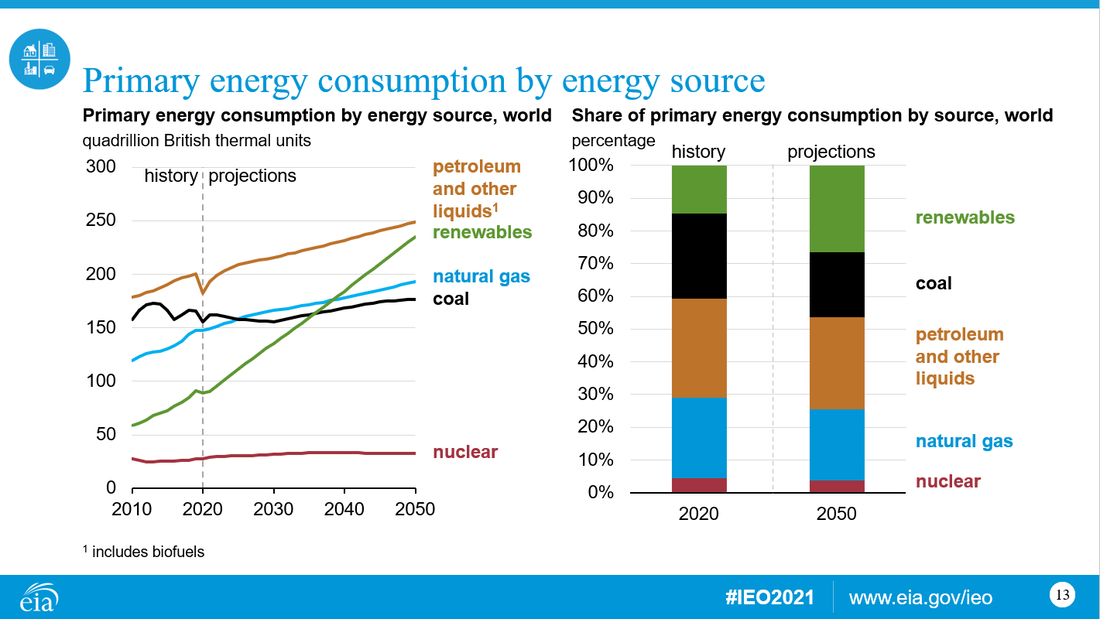 This blog has tracked IEA primary energy projections for over ten years. Comparing the 2021 projections for 2050 to the 2012 projections for 2050 shows an overall 2050 primary energy total as about the same as 2012 and 2020, projections, but the weights have shifted in favor of renewables. The graph shows renewables at about 25% of total primary energy in 2050 with about an overall increase in capacity of about 4X over 2020. Converting QBtu to TW years, that's about 8TW average generation or about 30 TW nameplate capacity for wind, solar, hydro and biomass. As a point of reference the current US electricity generation name plate capacity is about 1.2 TW The big takeaway is that roughly 75% of primary energy is still from fossil fuels which because of economic growth are still pumping out more CO2 every year out to 2050. Somehow climate optimists have persuaded themselves that CO2 emissions can be eliminated by 2050. The scale of renewables growth projected is large but realistic. This analysis does not factor in the additional generation from storage or the additional costs for grid enhancement. The report highlights that the doubling of energy consumption between now and 2050 is all from economic growth of the developing world so most of this new renewable energy is going to be deployed by them. There is a fantasy of renewables being cheaper than fossil fuels which is demonstrably false when all costs are counted. The developing world has consistently favored economic growth over climate change and large parts of the developed world are skeptical. None of this bodes well for increased deployment of renewables. If the fantasy that renewables are cheaper than fossil fuels was true there might be a chance that renewables could be deployed at a higher rate than these projections. Stratosolar holds out the possibility of renewables cheaper than fossil fuels that could be rapidly deployed by 2050. There is no other likely alternative. The reality of climate change is becoming increasingly obvious every year. We may have already crossed several tipping points where we cannot go back and more severe tipping points are on the horizon. By Edmund Kelly There is an increasing awareness of the impracticality of 100% renewable energy from wind and solar that is driven by real data and analysis. While this perspective is still seen as politically incorrect this awareness is increasingly pragmatic and not driven from an ideological political perspective. There is still plenty of climate change denial and fossil fuel rationalization around but common sense reasoning is slowly growing. This podcast from Soeren Hansen, a Danish scientist makes the case in depth using lots of data. It's not completely unbiased but the data it presents is real, comprehensive and undeniable. . Soeren Hansen: Why wind and solar will not work | Tom Nelson Pod #110 In this blog I have made the same case now for many years in support of why Stratosolar is a viable energy solution that solves the problems illustrated in this presentation. The increased capacity factor and the lack of long duration intermittency illustrated by the German dunkelflauten transform Stratosolar into the cheapest and most scalable source of electricity. By Edmund Kelly This is the pdf file with the slides referenced from the podcast above.
The world is slowly adopting a clean energy strategy based around Solar PV, wind, battery energy storage and High Voltage transmission. However the adoption rate is slow, particularly in the US and developing countries and the unfortunate truth is that with current trends, fossil fuels are likely to remain dominant to 2050 and significant for the rest of the century out to 2100.
The fundamental constraints are complexity and cost. While various academic studies show that a clean energy solution is probably technically feasible, the details of particular solutions and how they might be implemented do not exist. They also rely on scaling technologies and solving organizational and political problems that are worsening, not improving. Implicit in all clean energy plans is the assumption that costs will reduce as scale increases. This has so far proven true for the cost of PV panels and wind turbines which has fueled this optimism. However, as we have pointed out, the costs of integrating solar and wind into existing grids are high, and the evidence already is that the price of electricity to consumers has risen substantially in large economies that have invested in clean energy like Germany, England and California. The reality is that wind and solar already increase the price of electricity with relatively low market penetration. No economy has yet installed sufficient capacity of intermittent renewables to where further growth requires energy storage. This highlights the fact that as intermittent renewables market share increases new additional costs are added that further increase the cost of electricity in a nonlinear fashion. There are four stages to replacing fossil fuel generation with intermittent wind and solar, each of which adds substantial additional cost.
By Edmund Kelly It has become common for mainstream media to assert that solar and wind are the cheapest source of electricity. However if we examine the price of electricity to consumers of electricity in markets where solar and wind have become a significant source of electricity we find that the price of electricity has risen significantly in them all. Price is what matters. Using the narrow definition of the cost of electricity generation, commonly called the levelized cost of electricity (LCOE) , wind and solar are cheap and can compete with fossil fuels in some markets. However LCOE just measures the cost of electricity where it is attached to the grid. The cost of transmission and distribution and managing a reliable electricity supply has to be added to get the consumers price of electricity. It is false advertising to consumers to focus on LCOE. In two previous blog posts that cover the case for Germany, California and the US as a whole I discussed a simple explanation based on ample public data on electricity generation and electricity capacity. This enables a simple calculation of overall capacity factor. In capital intensive industries like electricity supply, the lower the capacity factor, the higher the price needed to fund the capital expense. Recently, the United Kingdom has also become a major economy that has a substantial percentage of its electricity generated from renewables, mainly wind and biofuels. Calculating the capacity factor for the UK from public data adds to the evidence of the previous three cases relating reduced capacity factor to higher electricity prices. 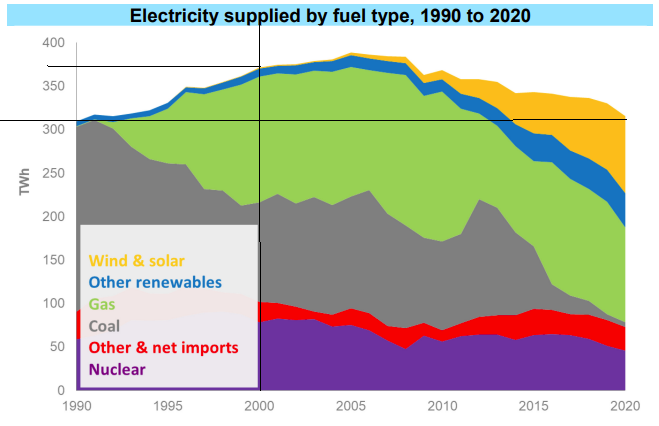 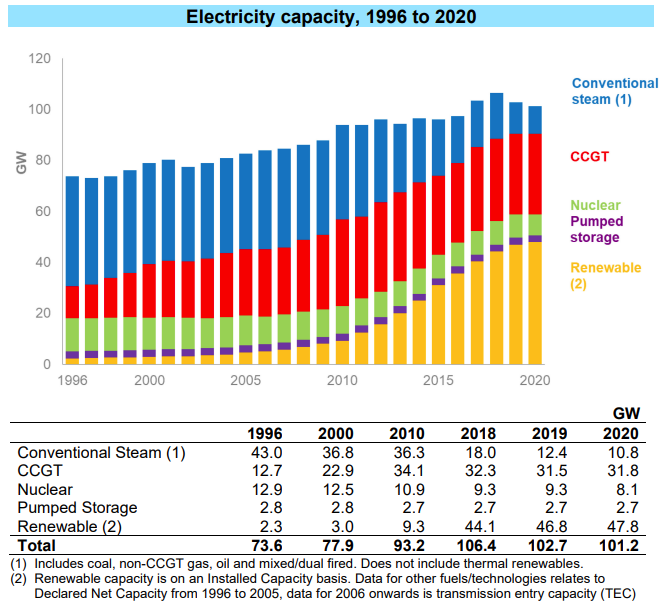 The graphs above show historical UK generation in TWh and Capacity in GW. Using the data for the year 2000, the capacity factor was 54%. For 2020 capacity factor was 34%.. The 2020 price was 125% of the 2010 price set to 100% and the 2000 price was 58% relative to 2000. The graph below shows the UK data of price against capacity factor. As capacity factor falls, prices rise. Falling capacity factor explains higher prices, the same as for Germany, California and the US as a whole. 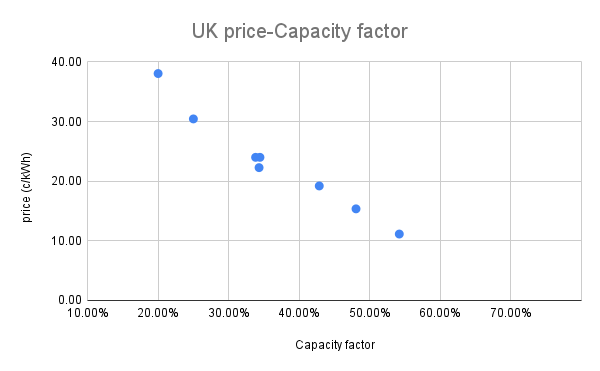 Projecting this trend forward, as more intermittent renewables are added, capacity factor will continue to fall and price will continue to rise as shown in the graph above. As wind and solar get to be a larger percentage of generation, curtailment will set in. To fix this will mean adding storage, which will also add capacity, reduce capacity factor and drive prices even higher. The UK’s experience with wind volatility would say they will always have a need for backup power. From their experience, wind can disappear for long periods and wind generation can drop more than 20 GW in less than a day. There is also significant annual and seasonal variation, much like hydro power variation with droughts in California.
The electricity price could easily double from current levels which would be around five times the price of electricity from fossil fuel generation. The UK, Germany and the US may be able to afford this, but the developing world won't. The biggest strategic problem with high electricity prices is how it raises the price of anything that uses significant amounts of electricity. Clean industrial processes for manufacturing commodities like steel, aluminum, copper and other metals will be uneconomic along with manufacturing clean synthetic fuels and processes like desalination. All of these are essential parts of a clean energy transition. Cheap clean electricity is the essential base component of a clean energy transition. This is where Stratosolar comes in. Electricity for less than that generated using fossil fuels. By Edmund Kelly http://www.stratosolar.com/blog/projecting-the-rising-cost-of-electricity-to-consumers-from-increased-generation-from-intermittent-wind-and-solar http://www.stratosolar.com/blog/the-true-cost-of-intermittent-renewable-energy https://assets.publishing.service.gov.uk/government/uploads/system/uploads/attachment_data/file/1032260/UK_Energy_in_Brief_2021.pdf Greenwashing is a term I was unfamiliar with until recently.
Greenwashing: disinformation disseminated by an organization so as to present an environmentally responsible public image. The COP gatherings every year along with IPCC reports on progress in climate change are the main political mechanisms to influence government policies. While the term “greenwashing” seems to be used to describe corporations making empty promises in order to look good, the term could equally apply to governments as a whole who make promises without real commitments to create the illusion of progress when there is none. The COP conferences highlight the conflict between economic growth and climate action, particularly in the developing world. Even if the developed world could eliminate all their emissions, growth in the developing world means that emissions would continue to rise. The current wind and solar favorites in the developed world are too expensive for the developing world which is why emissions are still growing. So COP conferences exist because of the concerns of environmentalists, but highlight the economic problems of the preferred solutions of environmentalists that make these solutions politically un-viable. Nevertheless these are still the politically correct solutions. https://www.un.org/sites/un2.un.org/files/high-level_expert_group_n7b.pdf By Edmund Kelly This article is a comprehensive discussion of the problems with building an electricity grid based on 100% renewable wind and solar energy. The article is fact and evidence based. The authors make the case that the various approaches that could be used to make wind and solar generation compatible with today's electricity on demand grid are impractical and will ultimately fail. This makes a welcome change from the status quo, 100% renewables, media based mantra, based on wildly optimistic and unrealistic assumptions.
The authors argue that instead of trying to make wind and solar a reliable on demand generator of electricity, we should instead adapt to using electricity when it is available. As a point of comparison they point out that Europe between 1500 and 1800 made extensive use of wind energy for sailing ships and windmills, and water energy for water wheels. In that world, energy was consumed when it was available and energy use was adapted to this reality. I concur with the analysis of the insurmountable problems of making intermittent generation an on demand resource, but I expect that adaptation of society to intermittent power would cost at least as much economic pain as mitigating intermittency. However it would work and help mitigate climate change in a sustainable way. In contrast, Stratosolar generation eliminates or solves these intermittency problems and generates electricity compatible with today’s electricity on demand grid without the need for expensive and unrealistic transmission and storage or painful societal change to adapt to unpredictable energy supply. By Edmund Kelly This very comprehensive article takes a realistic view of our current failing attempts to tackle climate change by reducing CO2 emissions with intermittent wind and solar. The article ends with the following summary.
"In summary, keep the priority squarely on the economic upliftment of 6 billion (and counting) developing world citizens, demand no climate change mitigation action other than the establishment of gradually rising CO2 pricing around the world, and shift all targeted technology support to RD&D of new solutions and the subsequent establishment of global value chains and scale.” I definitely agree with the targeted technology support to RD&D of new solutions. However, policies to implement carbon taxes and providing direct RD&D support have been pushed for decades without making any significant headway towards acceptance. Our experience with Stratosolar can speak directly to the lack of imagination and the inadequacy of current RD&D funding for innovative solutions. By Edmund Kelly https://medium.com/a-balanced-transition/climate-action-when-the-cure-becomes-worse-than-the-disease-7912e8ca51d1 |
Archives
December 2023
Categories
All
|
||
 RSS Feed
|
© 2024 StratoSolar Inc. All rights reserved.
|
Contact Us
|