
|
I have previously published an analysis of the true future cost of electricity by projecting current trends into a future in which intermittent wind and solar predominate electricity generation. That analysis used data from Germany and California, where renewables penetration for large markets is the highest. The analysis shows the correlation of price rise with reduced capacity factor for both markets. Correlation is not causation so critics could claim these correlations are unique to factors in California and Germany. This new analysis uses overall US data for a much larger and more diverse market. The results are much the same as before which reinforces the causal link between reducing capacity factor and rising electricity prices. 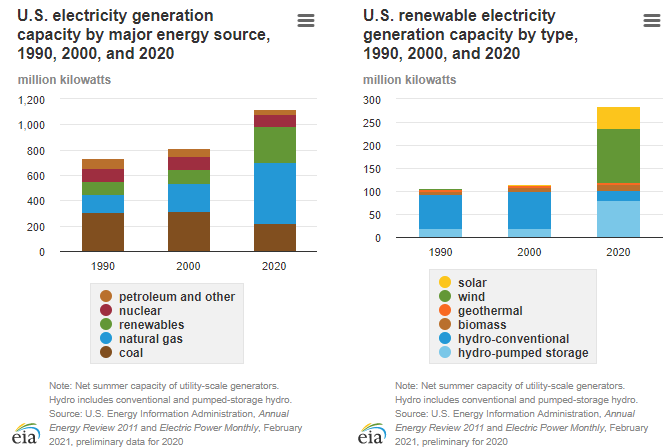 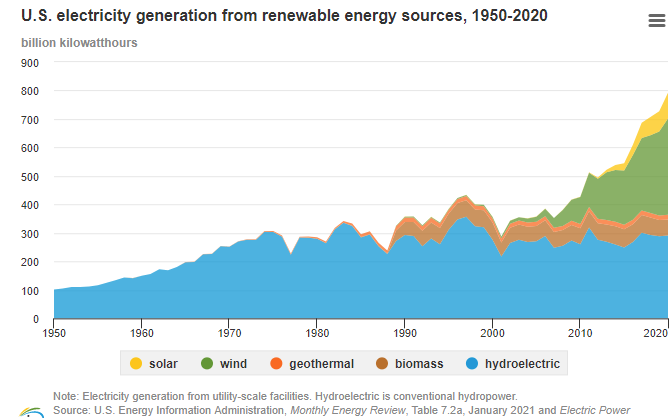 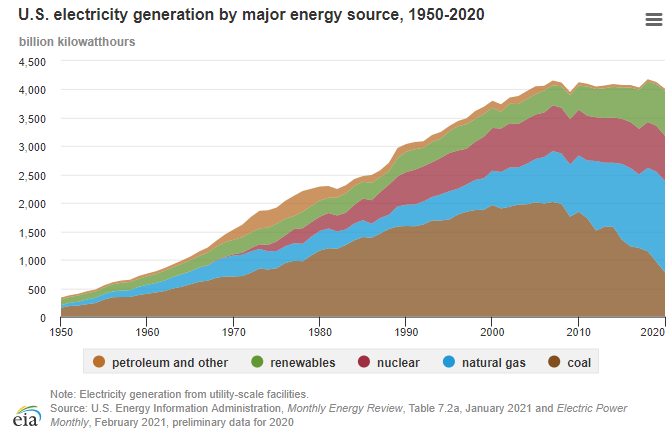 As the EIA graph above shows, US generation has been stable at about 4000 billion kWh (4000TWh) from 2005 to 2020. While the overall generation has been stable, coal has declined, natural gas has grown, and renewables have grown. In this graph renewables include large hydro and bio (mostly burning wood). From the generation capacity graph above, capacity grew from 800GW in 2000 to 1100GW in 2020. Extrapolating, this would be from 900GW in 2005 to 1100GW in 2020. Most of this new capacity was renewables which grew by 150GW. Natural gas grew as coal declined for an overall gain of about 50GW. This means overall capacity factor has declined from 51% to 41% as renewables were added. The average price of electricity for the US has grown from around $0.09/kWh to over $0.13/kWh from 2010 to 2020. This means that as capacity factor fell from 51% to 41% the price rose from $0.09/kWh to $0.13/kWh. 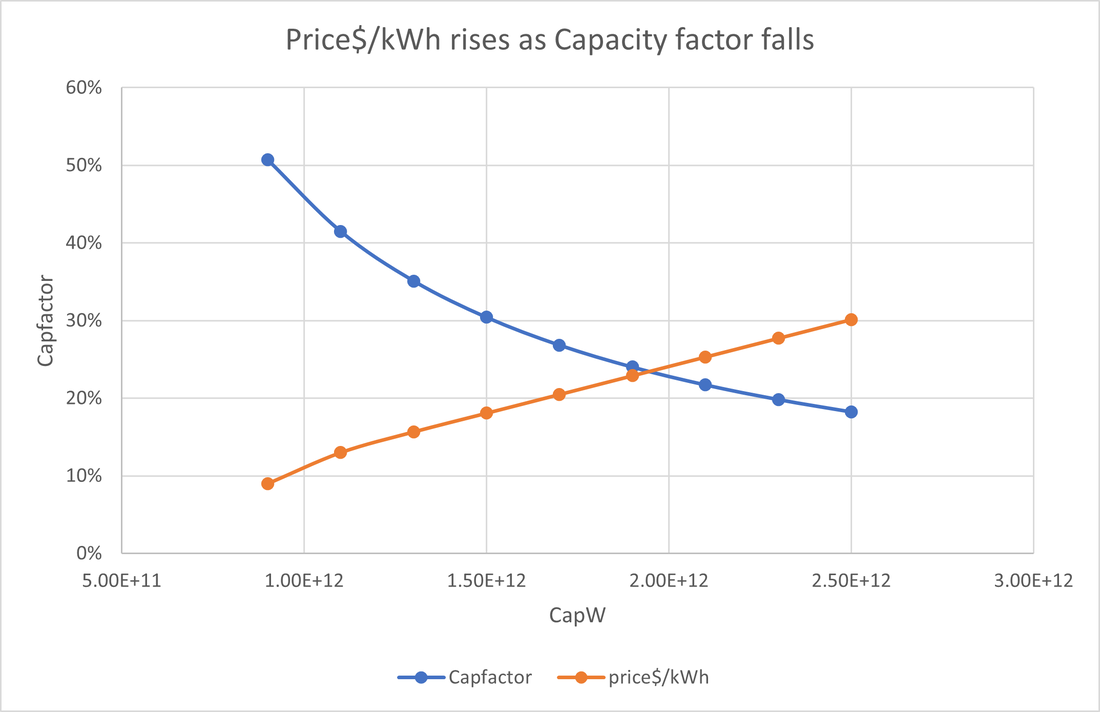 Extrapolating forward from this US trend of rising $/kWh as capacity factor falls with added renewable generation, we get the graph above. When capacity gets to 2,500GW (2.5e12W) the capacity factor will have fallen to 18% and price will have risen to $0.30/kWh. Some of this new capacity will be from storage. Falling generation costs will be more than balanced by rising transmission costs. This graph does not have a timeframe for this additional growth. At current capacity growth rates it would be the end of the century.
This capacity of mostly intermittent renewables and storage might get close to 100% renewable generation at today’s electricity demand. However, demand will have to increase significantly to electrify the economy by charging EVs and supplying heat pumps for domestic and commercial heating and cooling etc. This would imply a need for significantly more generation. A conservative estimate for an all-electric US economy might be 5,000GW of mostly intermittent generation capacity compared to 1,100GW of capacity today. So, 3,900 GW of new capacity between now and 2050 would be 130GW every year. For comparison, currently all wind and solar total about 150GW. So far, the average US electricity price rise has been about 45% as renewables penetration has been modest. As renewables penetration increases, and all the additional costs for excess generation, storage and long-distance transmission get added in, the price will increase as shown, even with a falling cost of generation. For those who are convinced that global warming is an existential threat, paying a high price for electricity is seen as acceptable. They are happy to emphasize that the cost of wind and solar generation have declined while not mentioning the actual rise in the price of electricity. However, we already spend 8% of GDP on energy both in the US and as a global average. If we move to an all-electric economy with high priced renewables generation the percentage of GDP devoted to energy will have to rise considerably above 8%. This will not be politically acceptable except for rich pockets of the globe. Most of the growth in energy consumption is in the developing world. They will make the same decision that China made around 2000 and favor economic growth over the environment. This gets to the core argument. Solving global warming needs clean electric energy at prices below current electricity prices. This is something Stratosolar can potentially do but current intermittent wind and solar demonstrably cannot do. By Edmund Kelly
Comments
|
Archives
December 2023
Categories
All
|
 RSS Feed
|
© 2024 StratoSolar Inc. All rights reserved.
|
Contact Us
|