|
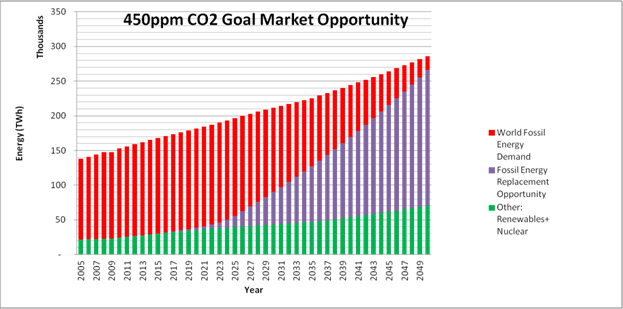
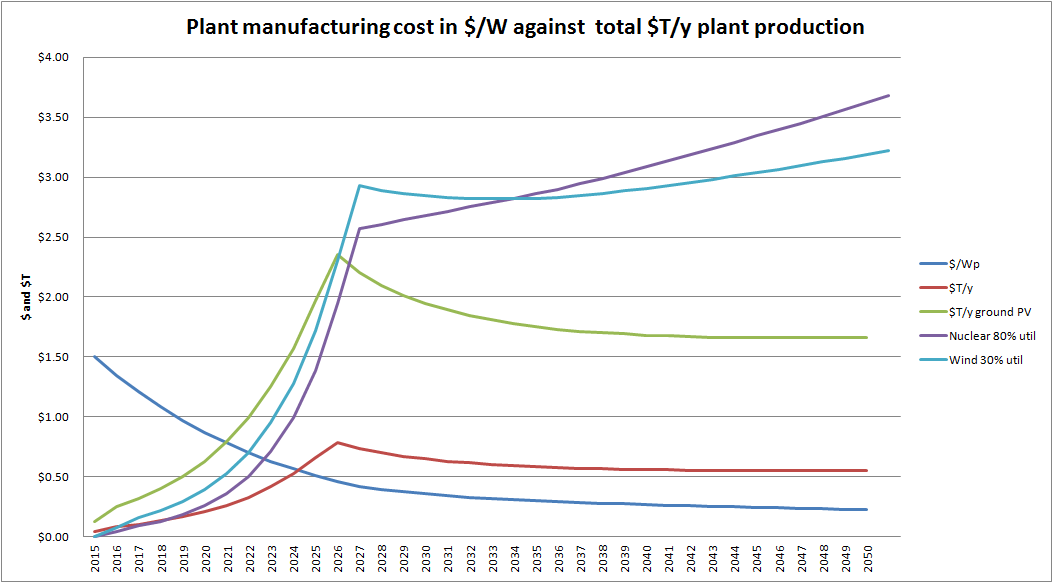
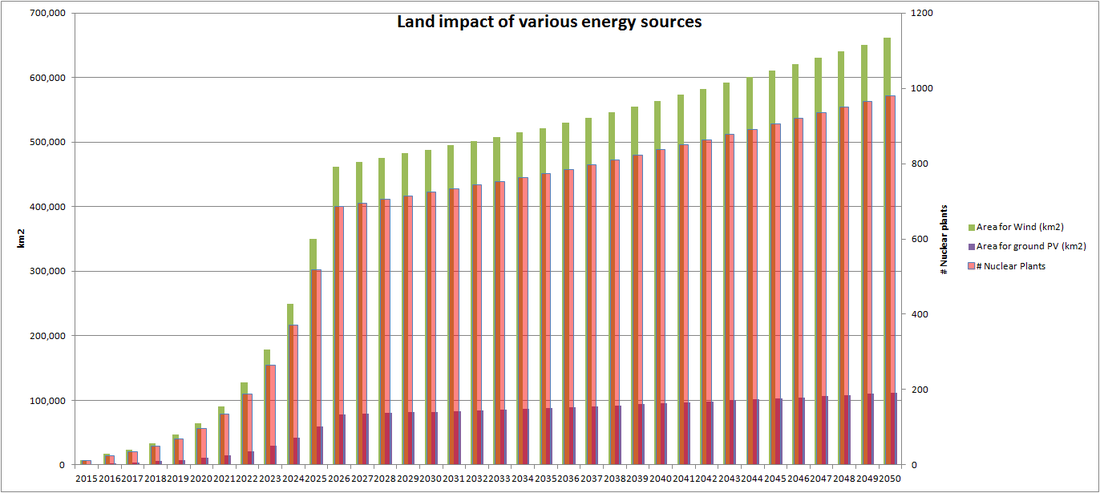
The previous two posts cover the scale of a StratoSolar solution that attempts to meet the 450ppm/2C CO2 reduction goals. They show a ten year ramp in TW/y production to a point where each years TW/y production is 3% of total energy demand. Production growth then slows to meet the yearly growth in energy demand. The graph above displays this information in a neutral format. This is still based on the projections from sources like the EIA mentioned for the previous posts. These all project significant growth for carbon neutral energy sources (shown in green) to about four times current levels. Most growth comes from wind and then solar after 2025 as it becomes more economically competitive. However the growth in the overall energy demand leads to significant growth in fossil energy supply, primarily coal. The red plus purple area shows this. The purple shows the amount of energy from fossil fuels that needs to be displaced to meet the 450ppm goal. This is around 200,000TWh of yearly energy or 22TW of average generation capacity. The previous posts show how this can be accomplished with StratoSolar and how much harder it is with ground PV. The purple represents the market opportunity for cost competitive clean energy, or alternatively the scale of the tax and subsidy regime necessary to support uncompetitive green energy . This shows that even fast and aggressive solutions need about 40 years. The window of opportunity for any practical solution is very narrow. Current trends will raise CO2 to levels associated with a 20C planet. This graph shows the yearly capital cost of ramping wind, solar, nuclear and StratoSolar over ten years to 3% of energy demand and then maintaining 3%/y. These assume PV $/W prices follow a 20% learning curve from a $2/W starting point. This applies to ground PV at 12% utilization and StratoSolar PV at 36% utilization. We optimistically assume wind will follow an 8% learning curve and starts at $2/W and 30% utilization. We don’t apply a learning curve to nuclear but give it a $3/W cost and an 80% utilization, both of which are optimistic. This shows that wind and nuclear will exceed $3T/y, ground PV will overtake wind and approach $1.5T/y, and StratoSolar is around $0.5T/y. This only covers electricity generation costs. Converting to an electricity economy will require more transmission and distribution, and a synthetic fuels infrastructure as well. This will ultimately be an additional several $T/y. As well as consuming the large financial resources just described, all carbon neutral energy sources have huge and permanent land use impact. The scale is hard to imagine. If wind were the sole energy provider it would impact over 600,000km2 each year. That’s one Texas, or several European countries or Japans every year. Nuclear exclusion zones would be similar in area. For nuclear we would need to build nearly 1000 GW reactors each year. For comparison today total world nuclear is around 350GW. Ground PV needs 100,000km2/y, but excludes all other use. For most developed countries there is simply not enough land.
There is a beginning of an attempt to map out scenarios where today’s wind, solar and bio are capable of solving the 450ppm problem. However none address the whole problem in any realistic fashion. The problem with “all of the above†solutions is that it is possible to keep adding more elements to the solution, regardless of their practicality or economic impact. Common strategies are to reduce the projected energy demand using hypothetical efficiency gains, storage technologies or belt tightening morality. Other strategies only solve a part of the problem, like electricity, or ignore the land limit by expanding the supply of land to include unrealistic far away areas like the Sahara desert or mountains. StratoSolar-PV is economically viable, scales to the local energy demand regardless of geography, and has the least impact on land use and the environment. What’s not to like? By Edmund Kelly
Comments
A simple question is why can’t ground PV do the same thing as the StratoSolar scenario? The simple answer is it is too expensive and it won’t get cheap enough anytime soon. The sharp drop in PV prices over the last few years have stopped, and there is no rational basis for them to fall further for a long time. A good thing about the recent price drops is it has raised awareness of PV and its potential for further improvement. A bad thing is it has created over optimistic and unrealistic assessments of PV’s chance to be a significant energy provider in the short term.
In the end, energy is all about politics and economics. StratoSolar PV panels have an average utilization of 40%. Ground PV panels have an average utilization of about 13%. Based on a simple analysis, ground PV electricity costs three times as much, and importantly this is significantly more than electricity costs today. That means that it can only be sold with the help of subsidies. As Germany has demonstrated, profitability drives investment. By providing subsidies that guaranteed profitable investment, German private industry jumped at the opportunity and installations grew very rapidly. Japan and China are following Germany’s lead. But things are actually worse than this. Its always tempting measure solar with the best utilization from sunny places, but unfortunately with solar its all about geography. There are very few places with good solar near population centers. Southern California is a rare example. Take Germany as a more representative example. PV utilization in Germany is around 11% from the published data. Germany could do a deal with a sunny location and build HV transmission lines to transport the power. This has numerous problems. On purely money terms, as panels have reduced in cost, and transmission lines have not, its likely that the better PV utilization in the desert will not cover the HV transmission costs. Don’t forget that the transmission lines will have the low PV utilization, which more than doubles the cost compared to conventional HV transmission lines. On top of this are the political constraints. HV transmission lines are not liked, and the countries where the panels and HV transmission lines are placed may not be the most politically stable. Even in the US, politics and economics will favor New York, for example, building in New York rather than dealing with getting power from New Mexico via transmission lines through many states. What this means is that ground PV discriminates, and northern climes get to pay twice as much, or more for electricity. Economics will also dictate that southern climes will get most of the synthetic fuel business. Because of the lower utilization, ground PV electricity will always cost 3X StratoSolar electricity. This factor makes StratoSolar economic for electricity, and then fuels long before ground PV. The learning curve is good but not that good. The learning curve will not continue for ever, and when it slows it will create a permanent cost barrier that ground PV will never overcome. StratoSolar is far less variable with geography, so Germany or New York, for example could provide all their energy needs, both electricity and fuel, locally. So to summarize, ground PV is too far from viability today, and too variable with geography to ever be an easy political choice. StratoSolar is viable today, and does not discriminate against geography. The StratoSolar capital investment for both PV plants and synthetic fuel plants will average a sustainable $0.6T/year, in line with current world energy investment. $2T/year capital investment for ground PV is a lot harder to imagine. By Edmund Kelly The following describes a StratoSolar deployment. The key point this illustrates is the simplicity. This is not an "all of the above strategy" with lots of moving parts and government interventions to subsidize or tax various market participants. The impact on land and existing infrastructure is indirect, and not an impediment to deployment. China in particular could adopt this strategy and replace coal without penalizing GDP growth.
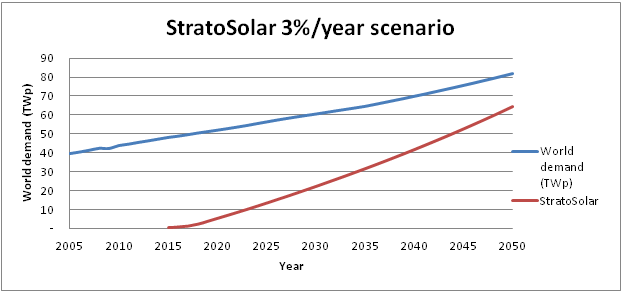
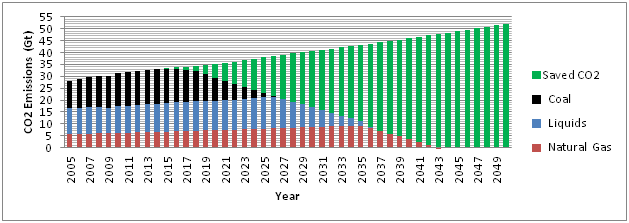
This shows that meeting the 450ppm CO2 goal in a realistic time frame with a realistic cost is feasible. Ground PV is still too expensive and will always be a factor of two to three behind in cost. The political costs and delays of land use and grid upgrades will further limit the scope and time frames of what is achievable. The key enabler is economic viability without subsidy. StratoSolar deployment sequence: Step 1) Deploy StratoSolar initially at $1.50/Wp, $0.06/kWh. This is profitable in most markets and volume growth is not constrained by amount or availability of subsidy. Step 2) After about 25GWp of cumulative production, StratoSolar initial learning curve takes costs down to $1.00/Wp, $0.04/kWh. Step 3) Start deploying electrolysers costing $0.50/W making hydrogen for $3.00/kg. This provides fuel for nighttime and winter electricity generation for $0.08/kWh and starts an electrolyser learning curve that will reduce the $/W electlolyser cost. Step 4) Continue deploying StratoSolar to 1TWP cumulative capacity. Costs reduce to $0.50/Wp, $0.02/kWh. Electrolysers reduce to $0.20/W, Hydrogen reduces to $1.25/kg, nighttime electricity reduces to $0.04/kWh. Step 5) Start liquid fuel synthesis using hydrogen and CO2. Synthetic gasoline costs $3.00/gallon. This starts a learning curve for fuel synthesis plants. Step 6) By the 10TWp cumulative deployment point costs are down to $0.25/Wp, $0.01/kWh, $0.60/kg for Hydrogen, and synthetic gasoline costs $1.00/gallon. This does not discuss time frames. These will depend on time to acceptance. The cumulative TWp needed to replace all world energy demand projected for 2045 is around 80TWp. The two time alligned graphs below illustrate a yearly StratoSolar goal of replacing 3% of world energy demand. Yearly StratoSolar production would need to ramp fairly quickly to 1.5TWp by 2020 and then increase slowly to about 2.5TWp by 2045 to meet increasing world energy demand. 3% is pretty aggressive, but not excessive and aligns with a 30 year plant life. Yearly world investment never exceeds $1T/y, as costs fall with cumulative installed capacity. For reference current world energy is about 8% of GDP, or about $6T/y. The 3%/year replacement scenario shown in the graph replaces about 80% of world energy with StratoSolar by 2050 with the remaining energy coming from the current projections for nuclear, hydro and other renewables. The CO2 emissions reduction chart below shows the CO2 reduction associated with this StratoSolar deployment scenario. We show a simple sequence with coal being replaced first, then oil, and finally gas. The reality would be along these lines but with less distinct transitions. Coal is the obvious first target as the biggest and dirtiest emitter and the easiest to replace with electricity. Oil is next as its high cost make it the easiest to replace with cost competitive synthetic fuels. Natural gas is last because it is the logical partner to solar, it’s the cleanest, and its low cost keeps it cost competitive for longer. The most striking aspect of the graph is the illustration of the scale of CO2 emissions saved. Cumulative CO2 emissions between 2005 and 2043 are 1,800Gt with business as usual versus 820Gt with StratoSolar. By 2043 CO2 emissions could be zero, whereas business as usual is pumping out over 50Gt/year . 820Gt is well within the 450ppm CO2 goal of 1,700Gt. Sources: History: U.S. Energy Information Administration (EIA), International Energy Statistics database (as of March2011), website www.eia.gov/ies; and International Energy Agency, Balances of OECD and NonOECD Statistics (2010),website www.iea.org (subscription site). Projections: EIA, Annual Energy Outlook 2011, DOE/EIA0383(2011) (Washington, DC:May 2011); AEO2011 National Energy Modeling System, run REF2011.D020911A, website www.eia.gov/aeo, and World Energy. By Edmund Kelly Its interesting to get the perspective of business analysts on the state of PV. While they have their own biases, they are not driven by renewable energy convictions. Those whose views are shaped by their renewable energy convictions or industry insiders find it hard to be objective.
This economist article basically says that the industry is in trouble with too much capacity (60GW) relative to demand (30GW), and that China, by maintaining zombie firms is hurting the business for the longer term by slowing the necessary restructuring. This argues for prices to stabilize for several years until supply is matched to demand and it is possible to build new plants with better economics. On the positive side this shows that the PV business has become mainstream with mainstream business news like the Economist and financial analysts from places like Bloomberg and CitiBank paying it serious attention. By Edmund Kelly |
Archives
December 2023
Categories
All
|
|
© 2024 StratoSolar Inc. All rights reserved.
|
Contact Us
|

 RSS Feed