
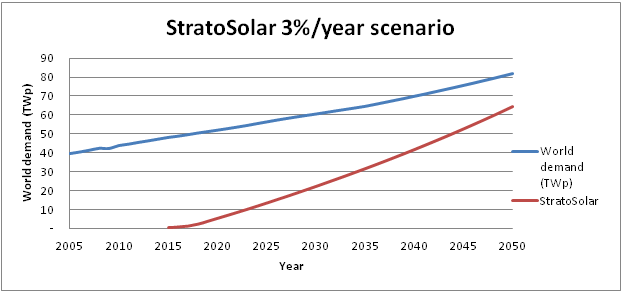
 The following describes a StratoSolar deployment. The key point this illustrates is the simplicity. This is not an "all of the above strategy" with lots of moving parts and government interventions to subsidize or tax various market participants. The impact on land and existing infrastructure is indirect, and not an impediment to deployment. China in particular could adopt this strategy and replace coal without penalizing GDP growth. This shows that meeting the 450ppm CO2 goal in a realistic time frame with a realistic cost is feasible. Ground PV is still too expensive and will always be a factor of two to three behind in cost. The political costs and delays of land use and grid upgrades will further limit the scope and time frames of what is achievable. The key enabler is economic viability without subsidy. StratoSolar deployment sequence: Step 1) Deploy StratoSolar initially at $1.50/Wp, $0.06/kWh. This is profitable in most markets and volume growth is not constrained by amount or availability of subsidy. Step 2) After about 25GWp of cumulative production, StratoSolar initial learning curve takes costs down to $1.00/Wp, $0.04/kWh. Step 3) Start deploying electrolysers costing $0.50/W making hydrogen for $3.00/kg. This provides fuel for nighttime and winter electricity generation for $0.08/kWh and starts an electrolyser learning curve that will reduce the $/W electlolyser cost. Step 4) Continue deploying StratoSolar to 1TWP cumulative capacity. Costs reduce to $0.50/Wp, $0.02/kWh. Electrolysers reduce to $0.20/W, Hydrogen reduces to $1.25/kg, nighttime electricity reduces to $0.04/kWh. Step 5) Start liquid fuel synthesis using hydrogen and CO2. Synthetic gasoline costs $3.00/gallon. This starts a learning curve for fuel synthesis plants. Step 6) By the 10TWp cumulative deployment point costs are down to $0.25/Wp, $0.01/kWh, $0.60/kg for Hydrogen, and synthetic gasoline costs $1.00/gallon. This does not discuss time frames. These will depend on time to acceptance. The cumulative TWp needed to replace all world energy demand projected for 2045 is around 80TWp. The two time alligned graphs below illustrate a yearly StratoSolar goal of replacing 3% of world energy demand. Yearly StratoSolar production would need to ramp fairly quickly to 1.5TWp by 2020 and then increase slowly to about 2.5TWp by 2045 to meet increasing world energy demand. 3% is pretty aggressive, but not excessive and aligns with a 30 year plant life. Yearly world investment never exceeds $1T/y, as costs fall with cumulative installed capacity. For reference current world energy is about 8% of GDP, or about $6T/y. The 3%/year replacement scenario shown in the graph replaces about 80% of world energy with StratoSolar by 2050 with the remaining energy coming from the current projections for nuclear, hydro and other renewables. The CO2 emissions reduction chart below shows the CO2 reduction associated with this StratoSolar deployment scenario. We show a simple sequence with coal being replaced first, then oil, and finally gas. The reality would be along these lines but with less distinct transitions. Coal is the obvious first target as the biggest and dirtiest emitter and the easiest to replace with electricity. Oil is next as its high cost make it the easiest to replace with cost competitive synthetic fuels. Natural gas is last because it is the logical partner to solar, it’s the cleanest, and its low cost keeps it cost competitive for longer. The most striking aspect of the graph is the illustration of the scale of CO2 emissions saved. Cumulative CO2 emissions between 2005 and 2043 are 1,800Gt with business as usual versus 820Gt with StratoSolar. By 2043 CO2 emissions could be zero, whereas business as usual is pumping out over 50Gt/year . 820Gt is well within the 450ppm CO2 goal of 1,700Gt. Sources: History: U.S. Energy Information Administration (EIA), International Energy Statistics database (as of March2011), website www.eia.gov/ies; and International Energy Agency, Balances of OECD and NonOECD Statistics (2010),website www.iea.org (subscription site). Projections: EIA, Annual Energy Outlook 2011, DOE/EIA0383(2011) (Washington, DC:May 2011); AEO2011 National Energy Modeling System, run REF2011.D020911A, website www.eia.gov/aeo, and World Energy. By Edmund Kelly 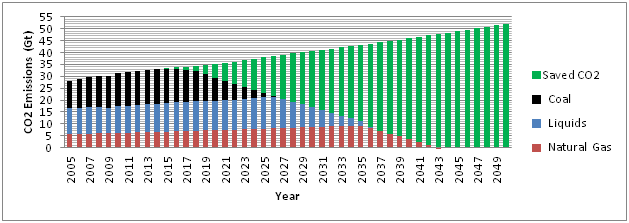
Comments
|
Archives
December 2023
Categories
All
|
 RSS Feed
|
© 2024 StratoSolar Inc. All rights reserved.
|
Contact Us
|