|
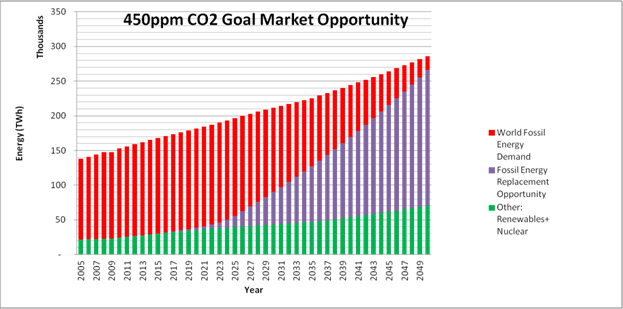
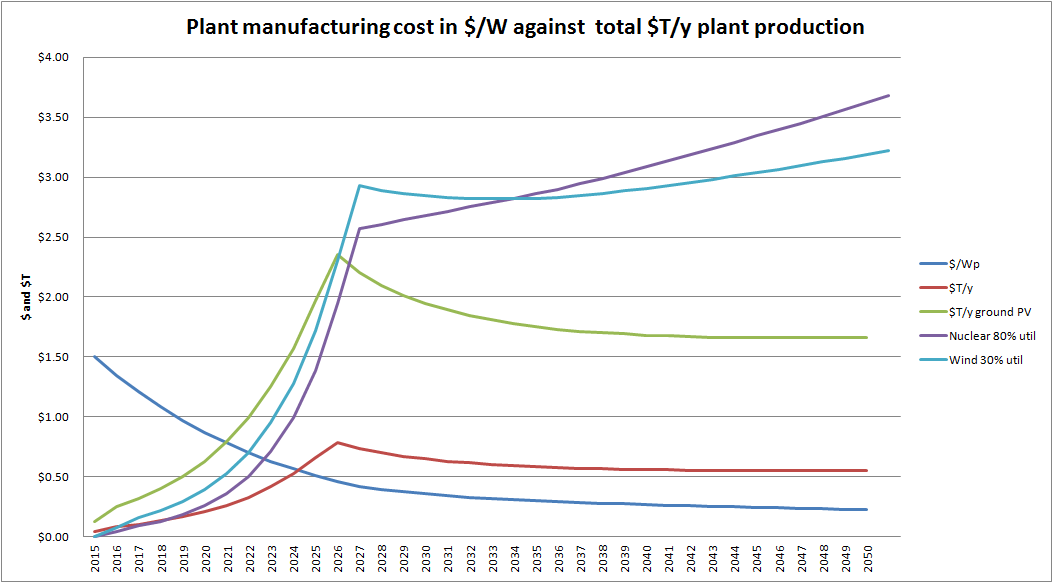
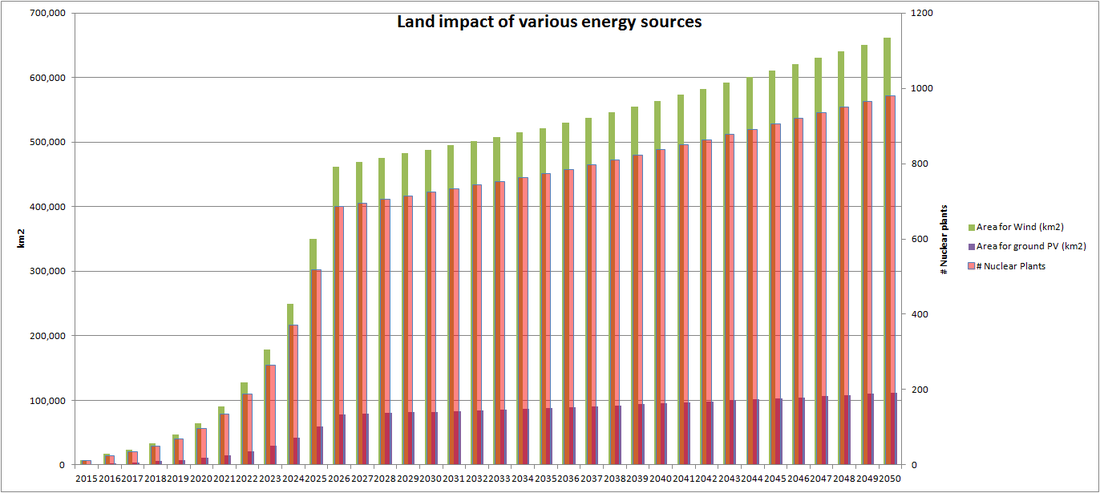
The previous two posts cover the scale of a StratoSolar solution that attempts to meet the 450ppm/2C CO2 reduction goals. They show a ten year ramp in TW/y production to a point where each years TW/y production is 3% of total energy demand. Production growth then slows to meet the yearly growth in energy demand. The graph above displays this information in a neutral format. This is still based on the projections from sources like the EIA mentioned for the previous posts. These all project significant growth for carbon neutral energy sources (shown in green) to about four times current levels. Most growth comes from wind and then solar after 2025 as it becomes more economically competitive. However the growth in the overall energy demand leads to significant growth in fossil energy supply, primarily coal. The red plus purple area shows this. The purple shows the amount of energy from fossil fuels that needs to be displaced to meet the 450ppm goal. This is around 200,000TWh of yearly energy or 22TW of average generation capacity. The previous posts show how this can be accomplished with StratoSolar and how much harder it is with ground PV. The purple represents the market opportunity for cost competitive clean energy, or alternatively the scale of the tax and subsidy regime necessary to support uncompetitive green energy . This shows that even fast and aggressive solutions need about 40 years. The window of opportunity for any practical solution is very narrow. Current trends will raise CO2 to levels associated with a 20C planet. This graph shows the yearly capital cost of ramping wind, solar, nuclear and StratoSolar over ten years to 3% of energy demand and then maintaining 3%/y. These assume PV $/W prices follow a 20% learning curve from a $2/W starting point. This applies to ground PV at 12% utilization and StratoSolar PV at 36% utilization. We optimistically assume wind will follow an 8% learning curve and starts at $2/W and 30% utilization. We don’t apply a learning curve to nuclear but give it a $3/W cost and an 80% utilization, both of which are optimistic. This shows that wind and nuclear will exceed $3T/y, ground PV will overtake wind and approach $1.5T/y, and StratoSolar is around $0.5T/y. This only covers electricity generation costs. Converting to an electricity economy will require more transmission and distribution, and a synthetic fuels infrastructure as well. This will ultimately be an additional several $T/y. As well as consuming the large financial resources just described, all carbon neutral energy sources have huge and permanent land use impact. The scale is hard to imagine. If wind were the sole energy provider it would impact over 600,000km2 each year. That’s one Texas, or several European countries or Japans every year. Nuclear exclusion zones would be similar in area. For nuclear we would need to build nearly 1000 GW reactors each year. For comparison today total world nuclear is around 350GW. Ground PV needs 100,000km2/y, but excludes all other use. For most developed countries there is simply not enough land.
There is a beginning of an attempt to map out scenarios where today’s wind, solar and bio are capable of solving the 450ppm problem. However none address the whole problem in any realistic fashion. The problem with “all of the above†solutions is that it is possible to keep adding more elements to the solution, regardless of their practicality or economic impact. Common strategies are to reduce the projected energy demand using hypothetical efficiency gains, storage technologies or belt tightening morality. Other strategies only solve a part of the problem, like electricity, or ignore the land limit by expanding the supply of land to include unrealistic far away areas like the Sahara desert or mountains. StratoSolar-PV is economically viable, scales to the local energy demand regardless of geography, and has the least impact on land use and the environment. What’s not to like? By Edmund Kelly
Comments
|
Archives
December 2023
Categories
All
|
|
© 2024 StratoSolar Inc. All rights reserved.
|
Contact Us
|


 RSS Feed