
|
This article admits the obvious fact that the odds of limiting the rise in global average temperatures to 1.5 degrees Celsius are slim to none. Despite this the official party line from politicians and scientists still focuses on this goal as if it were achievable. Similarly, the politically correct scientific and political view is that wind and solar are the cheapest sources of energy. These two views are inconsistent in that if wind and solar were really cheaper than fossil fuels in delivering electricity, their adoption rate should be much higher than it is which would in turn make the goal of 1.5 degrees Celsius more achievable.
As the article points out, admitting we are failing might raise the sense of urgency and spur more vigorous action. However this is unlikely. Politicians are most likely very aware how unattainable the 1.5 degree Celsius goal is. They are also aware of the political and financial constraints and at the same time want it to seem like they are accomplishing something useful. All that politics can do is adjust the landscape for market forces to provide the solutions. This applies as much to centrally planned China as free market democracies. Until there are technical solutions that truly provide cheaper clean energy with sustainable resources and no political roadblocks, governments are already doing what fits within today’s political constraints. Stratosolar is a technical solution that can make solar energy a realistic, cheaper, sustainable alternative to fossil fuels. It's a one stop packaged solution with no external dependencies beyond regulatory site approvals. Because of the large scale of plants, relatively few sites need to be approved, about 100 for the US and 1000 worldwide. The small number of sites and the low environmental impact should enable very rapid deployment. The climate problem is urgent but hoping that politicians will mandate drastic measures with severe economic consequences is naïve and foolish. Only when there is a viable alternative can politics act. This should have been the lesson learned from acid rain and ozone depletion where politics could act because viable solutions existed. Stratosolar is a potentially viable solution that enables political action to succeed. By Edmund Kelly https://www.newscientist.com/article/mg25433903-000-admitting-we-may-fail-to-hit-1-5c-can-help-us-tackle-climate-change/
Comments
According to this recent article in the Economist, the US clean energy investment in solar and wind generation is set to decline by at least 10% in 2022 over 2021. Despite a democrat administration and a congress that are theoretically very pro clean energy and want to supposedly invest heavily, the net effect of the administration's actions on tariffs and sanctions on China is to reduce investment while simultaneously congress cannot pass any new investment support. This not only sets back progress on achieving green energy goals, it also reduces employment by several hundred thousand jobs, severely damaging the democrat pro labor image.
The US is already a relatively low investor in clean energy, especially considering the size of its economy. Fossil fuel interests are dominant and the partisan divide ensures there is no consensus. The economist article explains the current decline is due more to internal politics within democrats than rising costs and supply chain constraints. The politically correct consensus on solving climate change by reducing CO2 focuses on government action. There has been government action for several decades and it has achieved some limited success. However progress stalled almost a decade ago and the simplest explanation is that we have reached the limit of what government action alone can achieve. Historically energy transitions only occur when there are significant benefits of the transition over the past status quo. The evidence is that the real cost of current wind and solar are too high for market forces to lead the transition and we have reached the political limit of government action. Stratosolar eliminates the need to solve the intermittency problem with solar and also reduces the cost of generation by a factor of three. Overall this means that it is a dispatchable direct replacement for natural gas at a lower cost. This can be a basis for a successful energy transition in a relatively short time frame. As with current solar, the learning curve is still operating and costs can continue to fall, further accelerating the clean energy transition. By Edmund Kelly 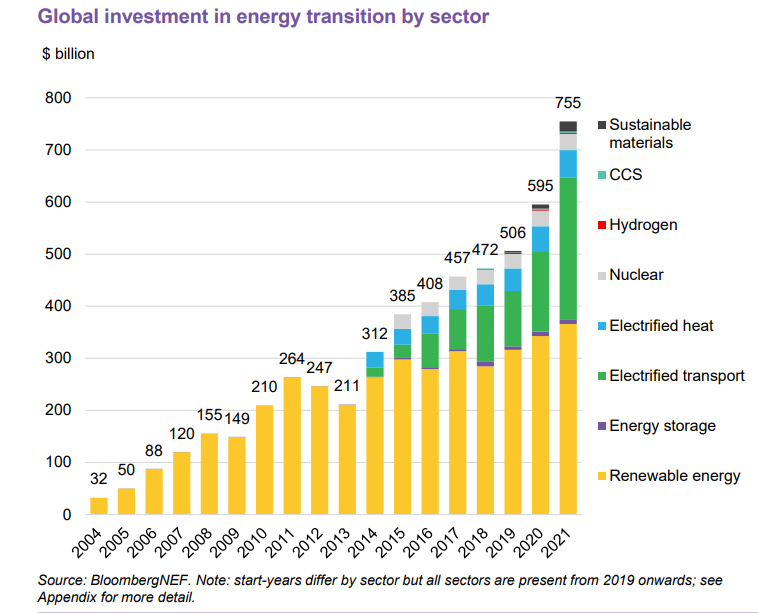 Bloomberg has broadened its focus beyond investment in renewable energy generation (shown above in yellow) to include investment in other clean energy sectors including electrified transport. As can be seen, electrified transport investment is growing fast and will soon surpass electricity generation investment. In previous blog posts we have observed that the investment in renewable energy generation has been pretty static at around $300B/year for the last decade. This graph shows a continuation of this trend. There is a slight upward trend but it's at about the underlying rate of inflation so there is no real investment growth in renewable energy generation. As we have previously asserted, this rate of investment in renewables generation is far below what is needed to achieve climate change goals. In the graph below, Bloomberg has quantified the increase in investment out to 2030 that is needed to meet climate change goals by 2050 for three scenarios. The green scenario is a renewable energy only solution. The gray scenario envisages carbon capture and storage (CCS) reducing the need for renewable generation. The red scenario is heavily dependent on nuclear power. The yearly investment in generation as shown has to increase approximately tenfold to decarbonize the energy sector in a timely manner. While renewable energy generation investment has stalled, given the announced plans from almost all major auto manufacturers and the competitive threat from Tesla, the projected increased investment in electrified transport is probably achievable. The most probable scenario is the green scenario, given the negative political sentiment surrounding nuclear and CCS. However a 10X growth in investment for renewables generation is hard to see happening given current circumstances where fossil fuels are resurgent and renewables are stalled. The data clearly shows that renewable energy investment is stalled. There are many technical and political headwinds that explain this stagnation. Stratosolar is a path that can overcome these headwinds and help achieve the green scenario with much lower investment due to its higher capacity factor and lack of a long term intermittency problem. By Edmund Kelly 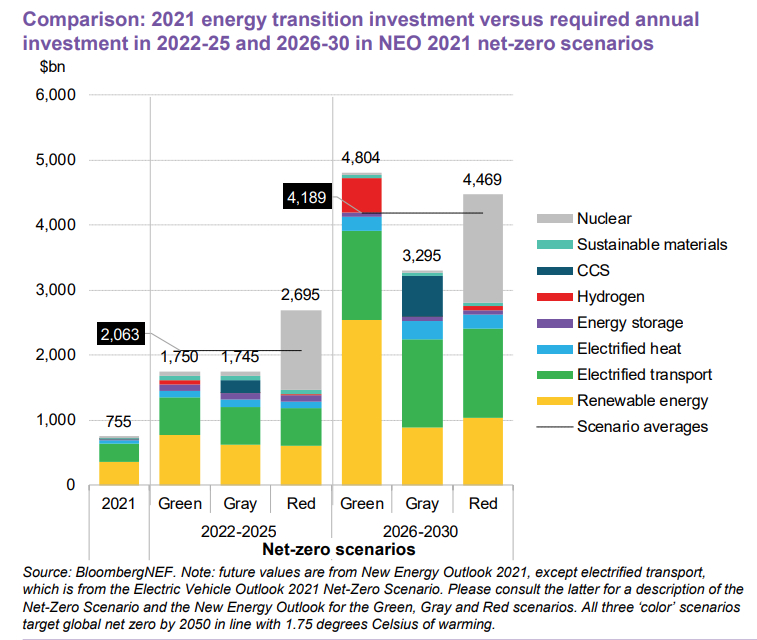 Current events in the Ukraine are a lesson in how a world dependent on fossil fuels is also a world formed by unstable relationships between geopolitical fossil fuels have and have nots.
There are two major geographies that are dependent on fossil fuel imports, Europe and China. China is a relatively recent but very fast growing importer of oil. There are two major exporters of oil, Russia and the middle east, dominated by Saudi Arabia. Europe has moved gradually to importing more from Russia as China has competed for oil from the middle east. Middle eastern oil is protected by the “Pax Americana” which meant that European oil used to be from a relatively secure source. Russia has proved to be other than secure and reliable. As Russia has grown militarily aggressive it is clear that the European gamble on a stable interdependent relationship with Russia has proven to be a bad choice. Europe has finally recognized this and is now in a mad scramble to reduce its dependency on Russian oil (and gas). Unfortunately the world supply of oil and gas is not very elastic and switching suppliers is going to be very costly. Increasing the emphasis on renewable energy as an alternative is going to accelerate the realization of how expensive and slow this path is. Already fossil fuel suppliers around the world are starting to increase supply and there are pressures building to keep and grow nuclear power. European renewables will face growing competition despite political support. Northern Europe has a geography that is bad for solar energy, particularly in winter. The European need for a reliable source of energy will badly impact their goal for clean renewable energy to fight climate change. In an ideal world there would be an affordable renewable energy alternative, that now that there is political will for fast change, could be quickly deployed. Stratosolar provides a clean and affordable renewable energy solution for Europe and the world. Affordable energy from solar energy that has no geographical constraint can make the world far more politically stable as well as helping solve the growing climate crisis. It avoids the technological and political risks of the other contenders like existing alternative energy sources, and nuclear fission and fusion. By Edmund Kelly Grid resiliency is increasingly a topic of discussion, largely because of very public large scale power disruptions that seem to be becoming more common. This recent article in the Wall Street Journal is an example. While the increasing amount of intermittent wind and solar generation are contributors to this decreased resiliency, given their still relatively low percentage of generation this is not the full story. The decline of coal and the accompanying rise in natural gas is the biggest change in electricity generation over the last decade. This has been accompanied by an increasingly deregulated industry where responsibility for resiliency is not clearly delineated.
It turns out that natural gas is dependent on its own distribution network of storage and gas pipelines which have different attributes from the coal distribution and storage network it has replaced. As was demonstrated in Texas in 2021, the gas network needs to be designed to handle freezing temperatures and is dependent on the electricity network to power parts of its infrastructure. The lesson is that big changes in the grid take time to stabilize and the current de centralized deregulated approach only reacts to structural problems after they are apparent, and does not anticipate. This should be a lesson for what is to become as wind and solar grow and coal and nuclear continue to decline. This will be a far more consequential change with far bigger problems to solve. It is easy to anticipate that the grid will become far less resilient very quickly. There will be an inevitable backlash when reality sinks in. By Edmund Kelly https://www.wsj.com/articles/americas-power-grid-is-increasingly-unreliable-11645196772 This peer reviewed article was published in Nature communications on October 21, 2021, titled “Geophysical constraints on the reliability of solar and wind power worldwide”. It uses global databases for wind and solar energy resource availability on an hourly basis over 39 years and over a fine grained geographical grid to model the potential reliability of various mixes of wind, solar, storage over large geographical areas that assume the transmission system can connect supply with demand. As such it does not try to estimate the economics, just reliability.
The analysis is pretty comprehensive and covers a wide range of options. The options that produce the highest reliability have excess generation of 1.5X to 3X, have 12 hours of storage and cover continent wide geographical areas. No area achieves 100% reliability though reliability in the high 90% range is achievable for all geographies. This still leaves some long duration outages everywhere. This analysis can be regarded as optimistic as it only covers 39 years of data. A simple analysis of California shows that there are very bad events that only occur once in 100 years or more. It also assumes perfect long distance transmission and a control system that always connects available supply with demand. The article discusses this and assumes some backup from non intermittent sources like geothermal, fuel synthesis, hydro etc. will be necessary. Say the shortfall is 1%. That does not mean that the backup generation capacity is 1% of generation capacity. It means that backup generation capacity approaching 100% of capacity is necessary for 1% of the time. So along with a very expensive wind and solar based electricity generation system, a large and expensive backup generation system is needed as well. This analysis shows that the true cost of using intermittent energy sources is not the direct cost of generation but the costs of trying to make them reliable by mitigating the effects of long duration intermittency. Stratosolar's big benefit is it has NO long duration intermittency and so does not have to incur the costs of excess generation capacity or long distance transmission that far exceed the costs of generation alone. Combined with Stratosolar’s 3X capacity factor advantage, the absence of these extra costs mean that Stratosolar's overall cost advantage over ground intermittent wind and solar is in the region of 5X to 10X cheaper. This means that synthetic fuels made using Stratosolar electricity will be 5X to 10X cheaper and provide an affordable source of seasonal storage and transportation fuels. Hopefully analysis like that from this paper will bring some sanity to the 100% renewables debate and open up discussion of alternatives that can achieve the reliability of power generation that is essential to modern economies. By Edmund Kelly The amount of resources required to build renewable sources of energy is substantial. Comparing ground Solar PV and Stratosolar, there are several areas where Stratosolar requires far fewer resources including glass, steel, mass for storage, and land.
Glass: Conventional PV panels use glass for protection from corrosion, primarily from water. Stratosolar is situated where there is no water in any form, which simplifies the protection problem considerably. Stratosolar panels use no glass and weigh 2kg/m2 or less. Glass for conventional PV panels weighs about 10 kg/m2 and panel total weight approaches 20 kg/m2. Today’s PV production is about 200 GW/year and uses about 10 million tons of glass. Scaled up to 2 TW/year to meet a 2050 deadline for net zero CO2 would mean 100 million tons of glass per year. Today's annual glass production is about 200 million tons of which about 100 million tons is for flat glass. Glass production will need to expand rapidly as will the supply of sand and energy to make the glass. To reiterate, Stratosolar needs no glass. Steel: today's PV uses steel for supporting structures, about the same weight as glass or about 100 million tons of steel per year. Stratosolar needs no steel. Energy storage: Ground based energy storage is mostly focused on battery and gravity energy storage technologies. Energy storage comes down to Wh/kg. Batteries range from about 200 Wh/kg for Lithium ion to less than 50 Wh/kg for various long duration storage technologies like flow batteries. Ground based gravity storage is about 0.3 Wh/kg. Stratosolar gravity storage is about 50 Wh/kg. If we estimate mass for storage based on daily storage of 10 hours for an annual addition of 1TW of electricity generation, or 10TWh/year of storage, this results in the following annual demand. Ground gravity storage: 40 billion tons of rock, dirt concrete or water. Stratosolar gravity storage: 200 million tons of water. Battery storage: 50 million tons to 200 million tons of chemicals. Because it does not have long duration intermittency to deal with, the stratosolar mass is the complete solution whereas ground PV will need a combination of more storage, excess generation and long distance transmission, all of which add a need for more resources. Land: This is perhaps the most constraining resource for ground PV, mostly because of political constraints. Most estimates lowball the need by ignoring the increased demand from an all electric economy and the added demand from economic growth over 30 years. Ground PV needs relatively flat land and panels have to be spaced to limit shading. Averaged over all geographies PV generates about 10W of electricity per meter squared (10 W/m2). For 1 TW of new electricity generation this adds up to about 100,000 km2 of land per year, or a total of 3 million km2 over 30 years. The total land mass for the US, Europe and China is about 10 million km2 each. Much of this is mountains and hills or remote deserts. Each of these geographies would need to find flat land near urban areas approaching 1 million square km or build more than 100,000 km of new high voltage transmission lines to remote deserts. Stratosolar only directly affects a little land for the tethers and an assembly area. There would be an urban exclusion zone for the area beneath the array, which could be built over mountains or coastal waters. Arrays would be few, perhaps 100 for the US and 1,000 worldwide and would be positioned perhaps 200km from urban areas, minimizing the need for long distance transmission. Stratosolar drastically reduces the need for material resources and precious land and is far more sustainable than current intermittent energy sources. By Edmund Kelly This article about the clean energy transition was recently published in the magazine City Journal, a conservative policy publication. It discusses the current energy disruptions in China, California and Europe as a preview of what is our likely future as renewable wind and solar generation increase as a percentage of generation. Being from a conservative viewpoint the article is not positive about clean energy but equally it is not a paean to fossil fuel energy either. It presents a picture of the impracticality of the current 100% renewable energy goals as I have discussed in many of my previous blog posts. It makes the point that the current energy disruptions are representative of our energy future as we add more wind and solar and the energy system as a whole becomes more unstable. Most of the current energy disruptions are from within the fossil supply chain but the diminishment of coal and the growth of wind and solar have indirectly and directly contributed to the energy system instability. This instability is bound to have political ramifications as the public as a whole may aspire to a clean energy future but will not be tolerant of an energy system that is increasingly unreliable at the same time as energy prices keep rising very substantially. As energy pragmatists and the data in the new paper linked below point out, the likely end point of the current drive for 100% renewable energy will likely be something like 80% renewable generation from wind, solar and storage with fossil fuel on demand generation as backup for the remaining 20%. In this scenario electricity will cost two or three times today’s electricity due to the costs of excess generation capacity, storage capacity and new long distance transmission capacity. The 80% can increase into the 90% range with an exponentially increasing cost of electricity which will face increasing political headwinds. These hard economic facts explain the slow rate of clean energy adoption and the corresponding low probability of achieving meaningful climate CO2 reduction goals. Stratosolar can provide 100% renewable electricity not 80% or 90%. It can do this at lower cost than today not much higher costs than today. It has low technological risk and its scalability largely depends on Solar PV which has already demonstrated its scalability. The world wants a 100% renewable energy solution but the current path cannot achieve that goal. The world also needs 100% renewable energy to be cheap which it is not but is misleadingly presented as such because of the desperate need for a viable clean energy solution to advance meaningful progress on climate CO2 reduction goals. By Edmund Kelly
Bloomberg solar PV update. Steady growth but not enough to meet the goals of the recent IPCC update9/24/2021 Bloomberg's latest global solar update includes their expectations out to 2030. They expect reasonable growth but no exceptional change that would reflect the world taking the latest IPCC warnings seriously or the US actually attaining the ambitious goals of the Biden administration. Bloomberg provides a factual business and market perspective on clean energy. This makes their projections more objective than many such as those from the IEA, EIA, or BP, which are more political and goal oriented projections that are influenced by either save the planet or climate denial interests. Factual global reporting on where the money comes from, where it goes, and what clean energy it buys exposes wishful thinking and is immensely valuable. This value is enhanced because the data is continuously updated and has been for decades which allows for a reasonable projection of trends into the future based on insight rather than simple linear extrapolation. 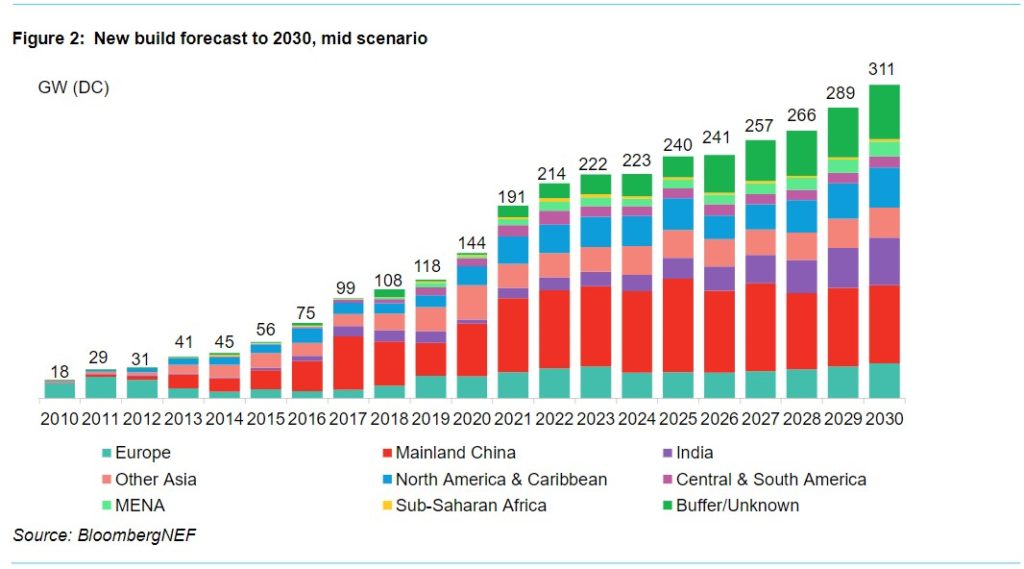 The past decade has shown that while the major markets in China, Europe and the US have waxed and waned, the global market has shown sustained growth in Solar PV capacity while maintaining a constant clean energy expenditure of around $300B/y. Bloomberg's projection to 2030 shows an expectation of similar behaviour, with $/W cost continuing to decline enabling capacity growth within a fairly constant budget.
In the US, the Biden administration has ambitious goals, but faces strong political headwinds from moderate Democrats within and Republicans without. History would not predict a significant change in the status quo. China has stabilized its internal deployments and only seeks to expand its exports. Europe has goals but is nowhere near the needed growth to decarbonize. The Bloomberg 2030 forecast appears to be highly realistic. Given the political and financial realities that this projection embodies, breaking this impasse will likely take a technological solution that relaxes these constraints. Fusion energy were it to succeed would be one such possibility that has shown some recent improvement in its prospects but is still a long shot. Stratosolar is another possible new approach but less risky, cheaper and quicker to demonstrate feasibility. By Edmund Kelly “The best part is no part. The best process is no process. It weighs nothing, it costs nothing, it can’t go wrong”...... Elon Musk.
General Elon principles: 1) Question the question The superior stratosolar solution comes from looking at the solar electricity generation problem from a new and radical perspective. 2) Reason from first principles. Look at the solar electricity generation problem as a whole, move the location and thereby eliminate the unnecessary parts. 3) Kill your darlings This is the fourth stratosolar design reboot. Build, test and continuously and rapidly iterate. 4) Undesign No long term electricity storage, no long distance electricity transmission, no omniscient electricity grid control, one third the number of PV panels; provides fully dispatchable electricity from solar energy; a superior product at a fraction of the cost. 5) Ideas supersede hierarchy Stratosolar does not have a hierarchy. Ideas win on a level playing field. 6) Everyone is a chief engineer. This describes stratosolar to a t. Without knowing it we have been following Elon’s principles all along. This speaks to the fundamental truth of the principles of innovating at the large scale. By Edmund Kelly |
Archives
December 2023
Categories
All
|
||
 RSS Feed
|
© 2024 StratoSolar Inc. All rights reserved.
|
Contact Us
|