
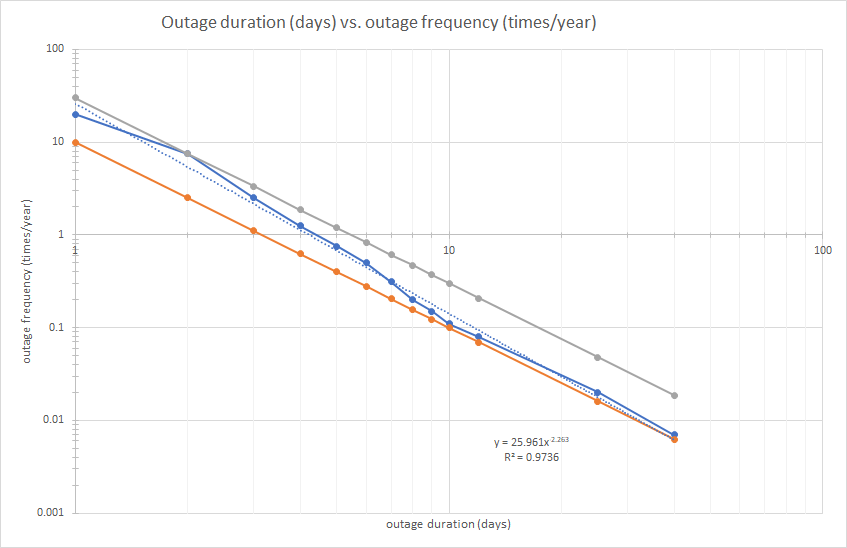
 The graph above captures the scope of solving the long term renewable energy intermittency problem with energy storage using California as an example. It shows that wide scale geographic intermittency follows an approximate inverse power rule. Given an intermittency duration in days it predicts the number of such events in a year using the relationship: Number of events = Constant/(duration of event)^2. So say Constant = 10 for California, then the number of 10 day events would be 10/10^2 = 10/100 =0.1 or one event every ten years. The number of two day events would be 2.5 per year. 20 day events would be one every 40 years. 40 day events about every one hundred and sixty years. This profile matches California's history of winter storms. Other geographies will have better or worse profiles but all generally follow the inverse square rule.
Even if storage became ten times as affordable as today, there would still be a reasonable probability of far more than 10 day outage events. Politics does tend to ignore lower probability long term problems, but the counter point is that these long duration events represent significant natural disasters where the electricity supply is crucial to survival. The graph is only an approximation but the model applies generally to weather related events. Severe events occur infrequently and the more severe the much less frequent. Global warming appears to be increasing the severity of infrequent weather related events, be they storms, floods, droughts, fires, hurricanes, extreme heat, extreme cold etc. Beyond one day events the amount of storage needed becomes unaffordable at current and foreseeable costs. The alternative solution then becomes additional generation far away outside the region of the intermittency events with long distance transmission to connect this additional generation to California. This is the general solution offered up by academic studies like those from Mark Jacobson at Stanford. The simple problem with these solutions is cost, as more than doubling generation and adding the necessary amount of new long distance transmission would at least triple the cost of California generation alone and the necessary nighttime storage adds another factor taking the total to four times California generation alone. This does not address the political problem of getting states to agree to regional solutions and environmentalists and others who object increasingly to transmission lines, wind farms and large solar arrays. Everybody is an environmentalist until they are confronted with the cost. If electricity were four or five times its current price, the broad political will is unlikely to last. Clean energy advocates are concerned about the threat of climate change and either don’t care about costs or just wish them away and assume costs will reduce. This will not persuade the broad populace or the developing world where economics are paramount. By Edmund Kelly
Comments
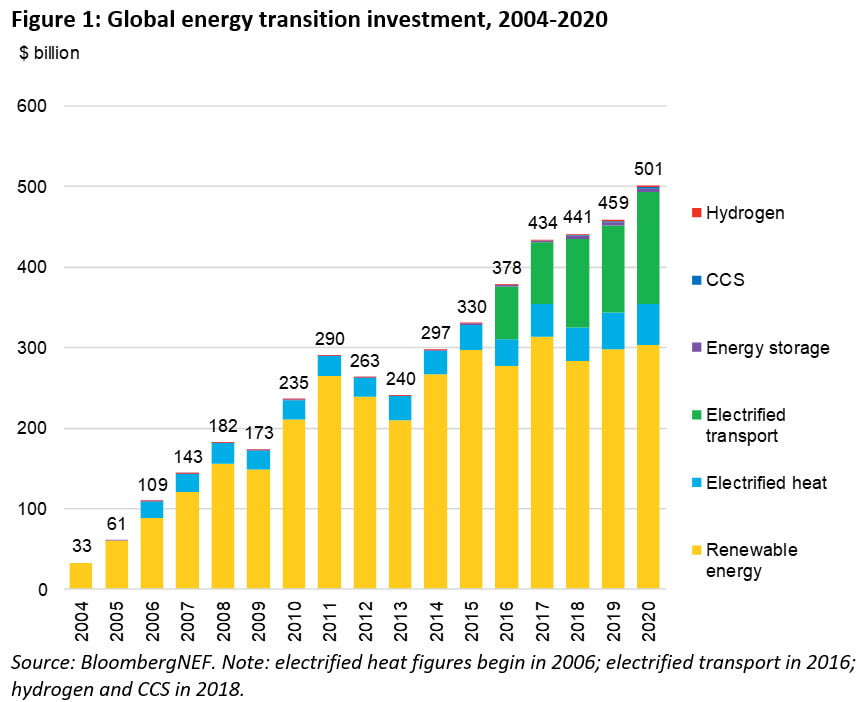 Bloomberg is broadening their clean energy investment survey to cover more than energy generation as shown in the latest graph covering up to the end of 2020 above. The yellow is the clean energy electricity generation component they have covered in the past. As can be seen, clean energy generation for 2020 is substantially unchanged from 2019. Clean energy investment has been substantially constant between $250B and $300B since 2011. This article covers things in more detail. In 2020 China and the US were down while Europe as a whole was up. Previously China was up and Europe was down. These changes are always directly related to policy and subsidy changes in each geography but the overall investment stays the same The bottom line is the world is not increasing its commitment to clean energy and at current levels of investment clean energy will not be significant until the end of the century, not 2040 as is the goal of many countries. The current investment limit is bounded by government support. To increase investment requires stand alone generation that can replace fossil fuel generation at a lower competitive cost without the limit of government support. Because intermittent generation relies on government mandates as well as subsidies, an investment is a complex and high risk venture that does not fit a market based model. The cost of intermittent generation does not reflect the increased price it brings to electricity consumers. This price is a result of the energy generation system as a whole becoming less efficient as it tries to adapt to intermittent generation. These inefficiencies grow exponentially as more intermittent generation is added to the grid and are at the heart of the stagnation in clean energy investment. If clean energy were leading to lower electricity prices, market forces would increase demand. This clearly is not happening. Stratosolar represents a path out of this quagmire but to get out of the quagmire there first has to be an acceptance that there is a quagmire. The investment data clearly demonstrates a quagmire but we seem to have the blind leading the blind into a fantasy future. Falling capital costs enabled record volumes of both solar (132GW) and wind (73GW) to be installed on the basis of the modest increase in dollar investment. This is roughly 200GW.
Total world energy demand is heading for around 30 TW by 2050 or about 1TW average new generation per year. This means that current generation alone is one tenth what is needed without adding in storage, transmission and other costs. Venture capital and private equity investment in renewables and storage increased 51% to $5.9 billion last year. Compare this to the $300B invested in wind and solar projects. Virtually none of this $5.9B was for new clean generation technology. This is the problem Stratosolar faces. There is no investment in new generation ideas. All the limited risk investment goes to storage and other status quo pursuits. By Edmund Kelly Michael Schellenberger is a well known clean energy advocate. He is however a sceptic on intermittent renewables and an advocate of nuclear energy as the only viable energy source that can reduce CO2 emissions. This puts him at odds with the environmentalist status quo, of whom he was once a significant member. Here is a recent article where he takes aim at recycling and environmental contamination problems with PV panel based solar energy.
While he is biased against solar, many of the points he makes are valid. Solar PV has grown so fast that lifetime and recycling problems are only starting to get serious attention. Many panels have short lives due to quality issues brought on by the extreme pressure to reduce costs. The backing material in many panels has been reduced to inadequate protection levels and many junction boxes are defective. Glass based panels are difficult and expensive to recycle and are mostly dumped in landfills where they leach heavy metals. Solar financials are based on 30 year panel lifetimes which are not likely to be achieved. Stratosolar uses lightweight panels and are not exposed to water based corrosion. They produce three or more times as much energy per panel. By Edmund Kelly I have previously published an analysis of the true future cost of electricity by projecting current trends into a future in which intermittent wind and solar predominate electricity generation. That analysis used data from Germany and California, where renewables penetration for large markets is the highest. The analysis shows the correlation of price rise with reduced capacity factor for both markets. Correlation is not causation so critics could claim these correlations are unique to factors in California and Germany. This new analysis uses overall US data for a much larger and more diverse market. The results are much the same as before which reinforces the causal link between reducing capacity factor and rising electricity prices. 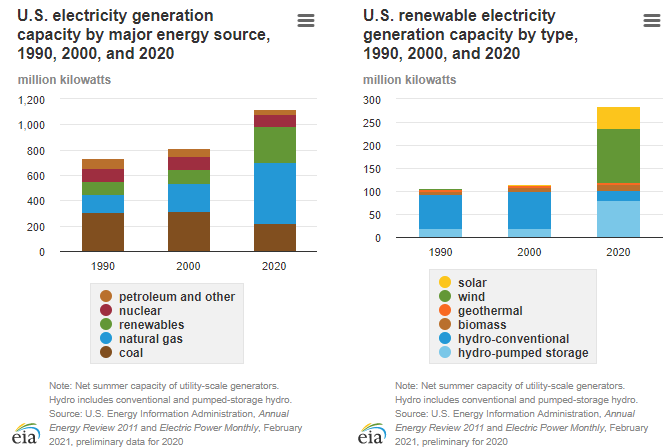 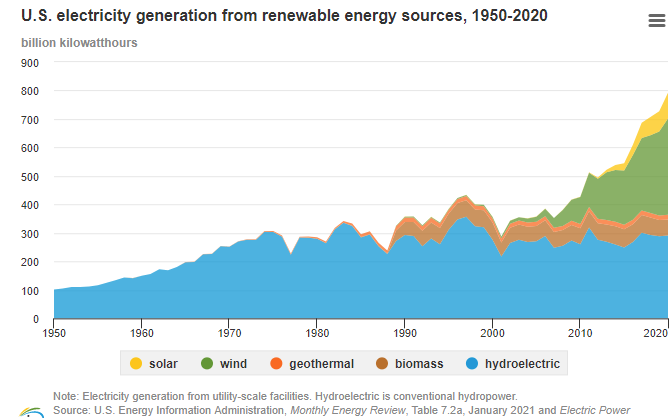 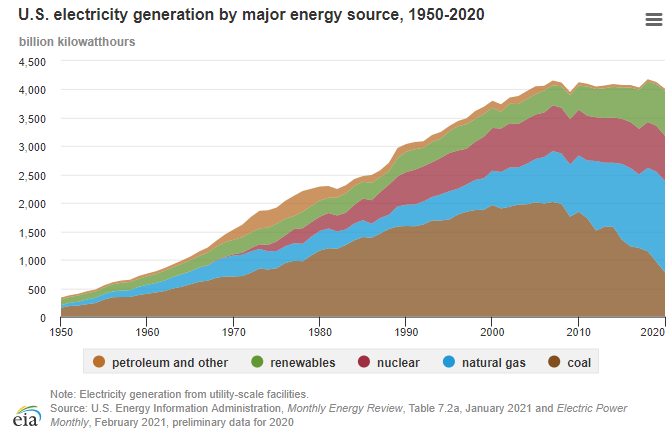 As the EIA graph above shows, US generation has been stable at about 4000 billion kWh (4000TWh) from 2005 to 2020. While the overall generation has been stable, coal has declined, natural gas has grown, and renewables have grown. In this graph renewables include large hydro and bio (mostly burning wood). From the generation capacity graph above, capacity grew from 800GW in 2000 to 1100GW in 2020. Extrapolating, this would be from 900GW in 2005 to 1100GW in 2020. Most of this new capacity was renewables which grew by 150GW. Natural gas grew as coal declined for an overall gain of about 50GW. This means overall capacity factor has declined from 51% to 41% as renewables were added. The average price of electricity for the US has grown from around $0.09/kWh to over $0.13/kWh from 2010 to 2020. This means that as capacity factor fell from 51% to 41% the price rose from $0.09/kWh to $0.13/kWh. 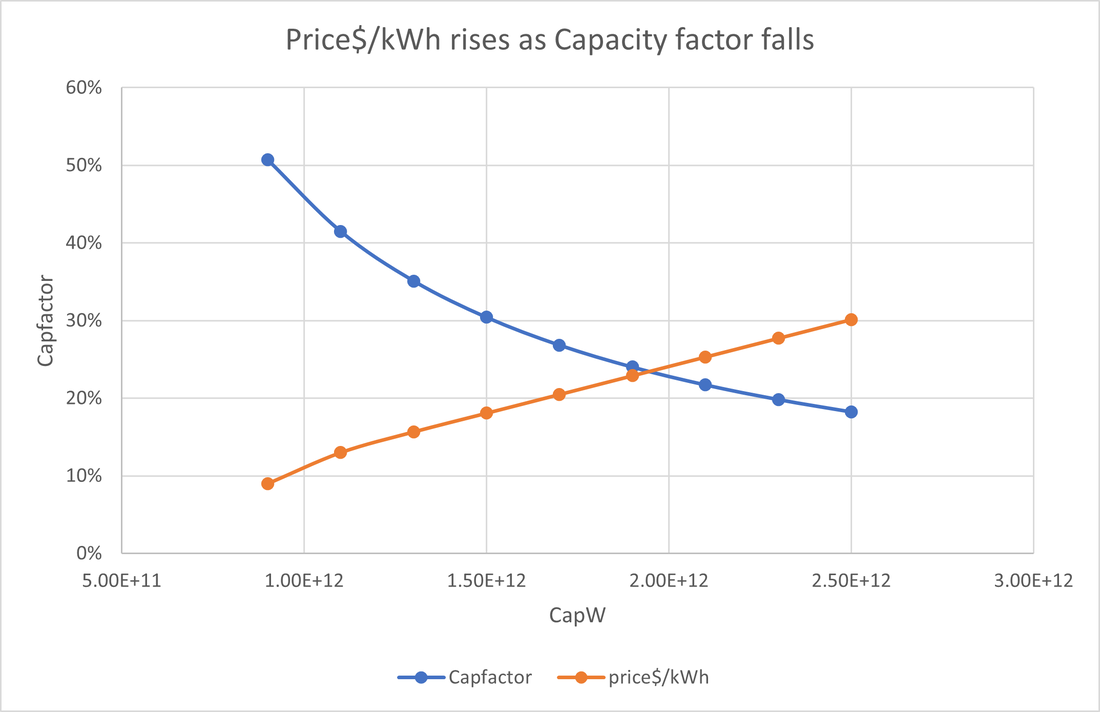 Extrapolating forward from this US trend of rising $/kWh as capacity factor falls with added renewable generation, we get the graph above. When capacity gets to 2,500GW (2.5e12W) the capacity factor will have fallen to 18% and price will have risen to $0.30/kWh. Some of this new capacity will be from storage. Falling generation costs will be more than balanced by rising transmission costs. This graph does not have a timeframe for this additional growth. At current capacity growth rates it would be the end of the century.
This capacity of mostly intermittent renewables and storage might get close to 100% renewable generation at today’s electricity demand. However, demand will have to increase significantly to electrify the economy by charging EVs and supplying heat pumps for domestic and commercial heating and cooling etc. This would imply a need for significantly more generation. A conservative estimate for an all-electric US economy might be 5,000GW of mostly intermittent generation capacity compared to 1,100GW of capacity today. So, 3,900 GW of new capacity between now and 2050 would be 130GW every year. For comparison, currently all wind and solar total about 150GW. So far, the average US electricity price rise has been about 45% as renewables penetration has been modest. As renewables penetration increases, and all the additional costs for excess generation, storage and long-distance transmission get added in, the price will increase as shown, even with a falling cost of generation. For those who are convinced that global warming is an existential threat, paying a high price for electricity is seen as acceptable. They are happy to emphasize that the cost of wind and solar generation have declined while not mentioning the actual rise in the price of electricity. However, we already spend 8% of GDP on energy both in the US and as a global average. If we move to an all-electric economy with high priced renewables generation the percentage of GDP devoted to energy will have to rise considerably above 8%. This will not be politically acceptable except for rich pockets of the globe. Most of the growth in energy consumption is in the developing world. They will make the same decision that China made around 2000 and favor economic growth over the environment. This gets to the core argument. Solving global warming needs clean electric energy at prices below current electricity prices. This is something Stratosolar can potentially do but current intermittent wind and solar demonstrably cannot do. By Edmund Kelly 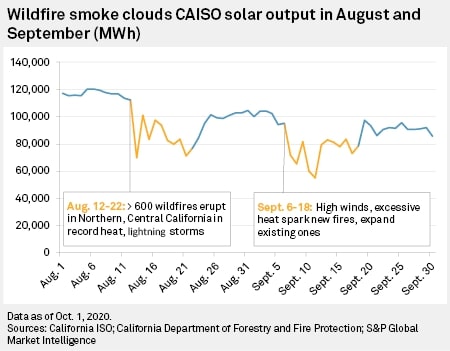 In my previous post I estimated the frequency per year of long duration solar intermittency events in California versus their length in days. This assumed the events were mostly clouds from winter storms. In recent years California wildfires have become more frequent and of greater magnitude. The summer of 2020 had significant smoke from wildfires that lasted over several months. The graph above shows the significant impact this had on STATEWIDE solar electricity generation.
Smoke significantly reduced overall generation, but the biggest issue is not the average reduction but the multi day peak reductions. Some of these were over 50% for several days measured over the entire state. This gap in generation from intermittency was covered by natural gas generation, but in the near future, when solar is the dominant form of generation and gas has been reduced or eliminated this will cause blackouts and severe disruption. Facing up to this reality will mean keeping natural gas in the short term and massively overbuilding wind, out of state solar and long distance transmission in the long term. As I discussed in a previous post this can be simply and accurately modelled by reducing the capacity factor and estimating the resulting higher cost of electricity to consumers. The electricity cost will be several multiples of today's cost of electricity. Combine this high cost with the increased demand for electricity from an economy with electrified car transportation and electrified heat pump domestic and commercial heating and you have a severe economic problem that even rich California will not be able to afford. Californian’s spend about 10% of GDP on all energy today. An electrified California with intermittent wind, solar and batteries will have to spend a lot more of its GDP on electricity. I cannot see how adjusting to even 20% of GDP will be politically acceptable, and more than 20% may be necessary. This gets me to my usual final word. Stratosolar electricity would cost LESS than today's electricity and an affordable smaller fraction of GDP. It is economically viable. Ground based intermittent solar is not. By Edmund Kelly 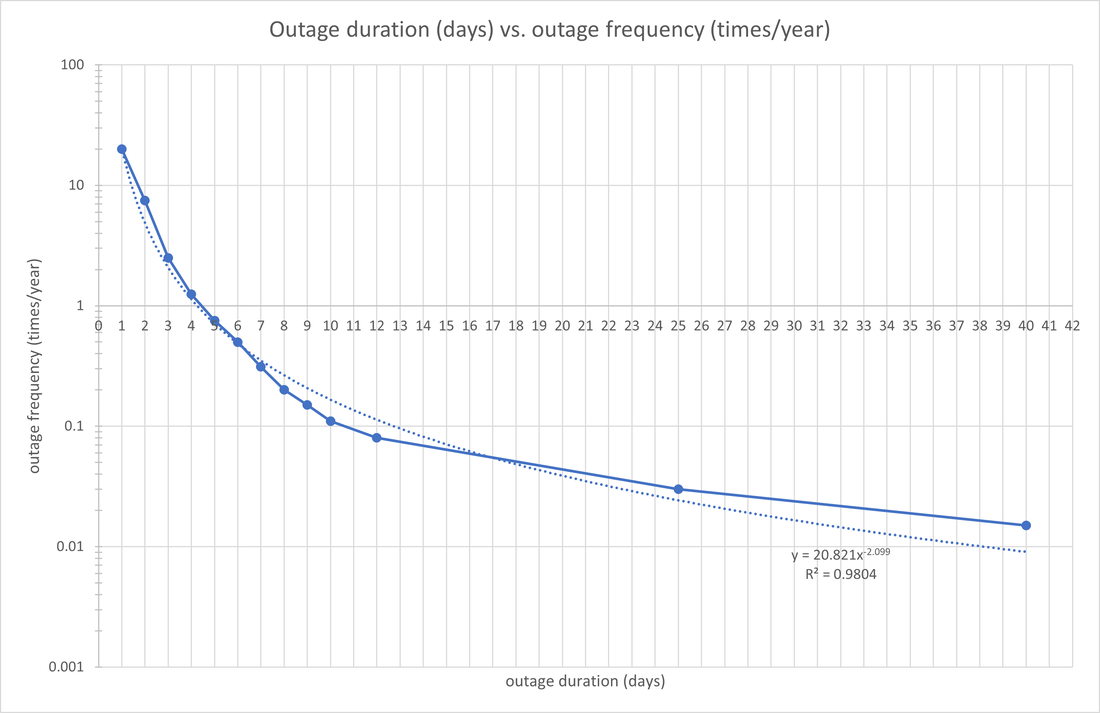 The goal of 100% renewable energy from intermittent wind, solar and battery technology is firmly established in California and Germany. These are the leaders that generally determine where the US and Europe are headed. The 100% goal was established by environmentalists and academics who back the achievability of 100% renewable energy with studies based on elaborate simulations.
The trouble with elaborate simulations is that their assumptions are opaque. Most simulate generation and consumption but assume transmission that connects the two. Intermittent generation is simulated using a limited history. The combination of these assumptions assume massive transmission over unrealistic long distances and omits rare extreme events. The graph above shows approximate yearly solar intermittency data for events affecting the entire state of California. The horizontal axis represents the duration in days of outages. The vertical axis represents the number of outages. The first data point on the left shows 20 outage events of duration one day. The point on the extreme right shows one event lasting around forty days every 150 years. The point crossing the horizontal axis shows one event lasting four days. On average events exceeding four days occur with rapidly decreasing frequency and are unlikely in any given year. These intermittency events mostly occur due to winter storms. The worst storm recorded in California occurred in the winter of 1861/1862 when it rained for 40 straight days. The geological record shows that storms of this magnitude occur around every 150 years. The phenomenon driving these events are known as atmospheric rivers which transfer tropical moisture in quantities exceeding the flow of the Mississippi and which occur randomly. Other points on the graph come from recorded storm events, mostly atmospheric river events of shorter duration. Current solar tries to deal with these events through storage and excess generation and distribution. To simply supply nighttime electricity without consideration of outages takes about 25% of peak DC generation capacity. So 1 GW of generation needs approximately 250MW (2.5GWh) of battery storage. To cover outages of one day adds double this storage requirement (500MW). Four days adds 8X etc. Both solar and battery costs are heading for the magical $1/W and will probably go lower over time. As I have covered in prior posts, as we increase solar, wind and storage capacity, capacity factor falls and electricity price rises. Four days of backup triples the cost of electricity from generation alone. More storage costs more. It is clear that covering longer duration outages is economically very painful. Building storage that only gets used once a decade seems folly. At that duration it is hard to trust that storage would still work. Forty days is even worse. However that forty day outage can occur in any year, and when it happens electricity will be desperately needed. California could build excess generation capacity in neighboring states and build long distance transmission. Both of these are expensive and outage events can exceed the boundaries of California. This with some storage would possibly work but at a similar overall cost to building storage. Other parts of the US and Europe would have possibly worse long duration outage events. They generally are farther north and have worse winter weather than California. The graph details would vary but the overall curve is the same, frequent short events and increasingly rare long events. When we compare this solar energy situation with a Stratosolar solution, the long duration outage problem simply disappears. Stratosolar simply needs nighttime storage for a complete dispatchable non interrupted solution. As battery technology becomes viable, Stratosolar can use this and it also has the option to develop gravity energy storage. The cost of Stratosolar generated electricity with around $1/W for solar PV and batteries is considerably lower than today’s fossil fuel cost of electricity. Solar would be viable in the cloudy north. No geographical dependency. By Edmund Kelly Over many blog posts I have used California and Germany as the leading examples of large economies investing heavily in reducing their CO2 emissions. They provide the evidence that current renewable energy from wind and solar raises the cost of electricity in a predictable manner. Capacity factor falls with increasing capacity. There is a lot of politics around energy in California, but despite this there is serious analysis. This report from E3, a respected California based analysis firm is a recent example.Long-Run Resource Adequacy under Deep Decarbonization Pathways for California
This report covers reducing all sources of CO2, not just electricity generation. It uses detailed modelling of future demand based on increased electrification and future alternative energy electricity supply based on reducing CO2 emissions to zero by 2050. It also models the intermittent nature of wind and solar using long term historical data. The report represents the work of many analysts over a long time and is based on tools developed over many years. Most people won’t read such a long report. Its conclusions are broadly in line with our simpler analysis. They modelled future scenarios based on California’s political consensus. It includes no nuclear and no new large hydro including pumped storage. It mainly relies on wind, solar and battery storage. They modeled solutions based on keeping a large part of current natural gas capacity as a backup and other solutions that instead increased battery storage. As with any reasonable analysis that realistically models renewable intermittency they find that the increased battery storage approach very rapidly rises to unrealistic high costs of electricity. The natural gas solution only adds a little CO2 and by 2050 it is unlikely that all sectors will reduce CO2 to zero either. It's the pragmatic solution. They project electricity prices rising significantly despite reducing costs for wind, solar and batteries. The cost estimates are the weakest part of the report. Additional costs for transmission and distribution are not considered and they will be significant. This report is inline with Stratosolars assessment. Current renewables will lead to significantly higher electricity costs and the demand for 100% renewables only damages the pragmatic “good” by demanding the unobtainable “best”. Because of its three times higher capacity factor and no long term intermittency, Stratosolar would be a vastly superior solution to what this report indicates is California's likely energy future. California is rich. Most other economies, particularly in the developing world cannot afford the California solution. California may not be able to afford the California solution. By Edmund Kelly 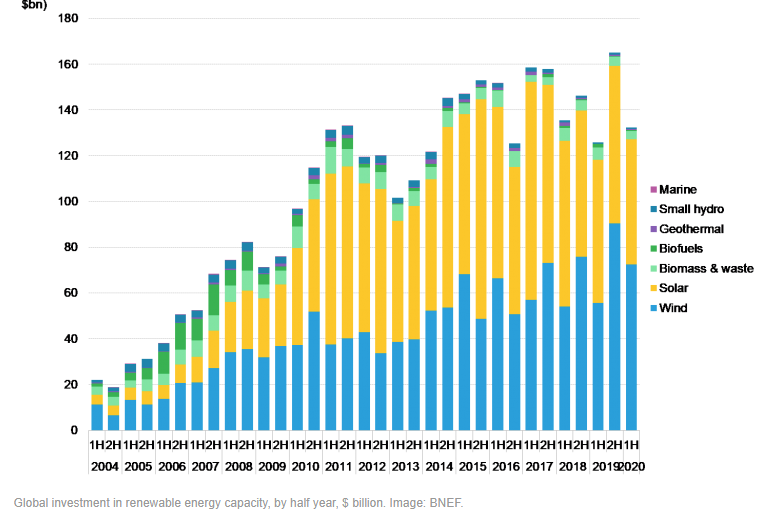 The latest BNEF report on world clean energy investment shows investment declining 12% for the first half of 2020. With the continuing coronavirus epidemic it's likely that the second half will be no better. This article summarizes the report. This continues the stagnant level of clean energy investment that has persisted since 2011. As the graph shows, a trend in recent years has been an overall increase in wind energy investment and a decline in solar energy investment. Also costs have fallen and the same dollars are buying more generation capacity.
As we have covered in prior blog posts, the generation purchased with this level of investment, while substantial, is insufficient to have a meaningful effect on CO2 emissions before 2050. This stagnant level of investment despite falling costs of generation clearly demonstrates that there is no market force driving growing investment and the market is still propped up by subsidies. Subsidies are fickle and each major geography has waxed and waned with markets declining and growing in a way that has coincidentally maintained a fairly constant level of investment worldwide. The hard truth that current wind and solar are not succeeding and will not succeed is still in complete denial from academics and environmentalists whose overwhelming desire for a solution blinds them to the plain evidence of failure that this stagnant investment illustrates. By Edmund Kelly Covid-19 has had us in lockdown since March. Slowly we are starting to surface, but early signs of an upsurge in the US States that are opening up are not encouraging. Work however is continuing.
Back in August 2017 I wrote this post on the debate between idealistic 100% renewables advocates from academia and more realistic engineering based renewable energy pragmatists. This new study (downloadable from here) is from the pragmatic side and continues the debate. While being more pragmatic, the report is still largely from academia and is weak on the economic costs. The report covers electricity generation for the US. The key difference with the 100% renewables approach is the willingness to include existing nuclear and large hydro in the mix and reduce the goal to 95% renewables by continuing to include natural gas. They propose to up the rate of deployment of wind and solar and add long distance transmission. All of this is eminently reasonable, but a realistic analysis based on capacity factors would show that solutions like this will raise the cost of electricity significantly more than they estimate. For the US a doubling or tripling of the cost of electricity is probably feasible except for the current toxic political environment. Perhaps a post Covid, post Trump political environment might be more accepting of tackling climate change? This kind of plan is possible for the rich nations of the world with an existing electricity supply that is being augmented by renewables investment. Developing nations have to provide all new infrastructure so the capital costs are higher as the investment for natural gas backup generation and transmission are additional new costs. Electricity generation is only a part of a clean energy solution. Transportation is as big if not bigger. A mass adoption of electric cars would have a significant impact on CO2 emissions.It is increasingly plausible that electric cars could be the majority by 2035. Electrification of transportation combined with incremental electricity plans like this could significantly reduce the rich world’s CO2 emissions. However the developing world is where all the growth in world energy use is coming from. The rich world high energy cost solution would significantly depress their economic growth potential. Historically this has been an insurmountable obstacle. Realistically, current partisan politics in the US also make high cost solutions unlikely and resistance in Europe is also growing. This gets us back to the central issue of economics. A renewable energy replacement for fossil fuels has to be lower cost to gain acceptance. Current renewable energy is more expensive despite efforts to portray it as lower cost by focusing on a narrow view of LCOE. Those who portray it as lower cost are reducing their credibility and threaten the long term viability of renewable energy. The Stratosolar approach could realistically provide a cheaper renewable energy solution acceptable to the developing world. By Edmund Kelly 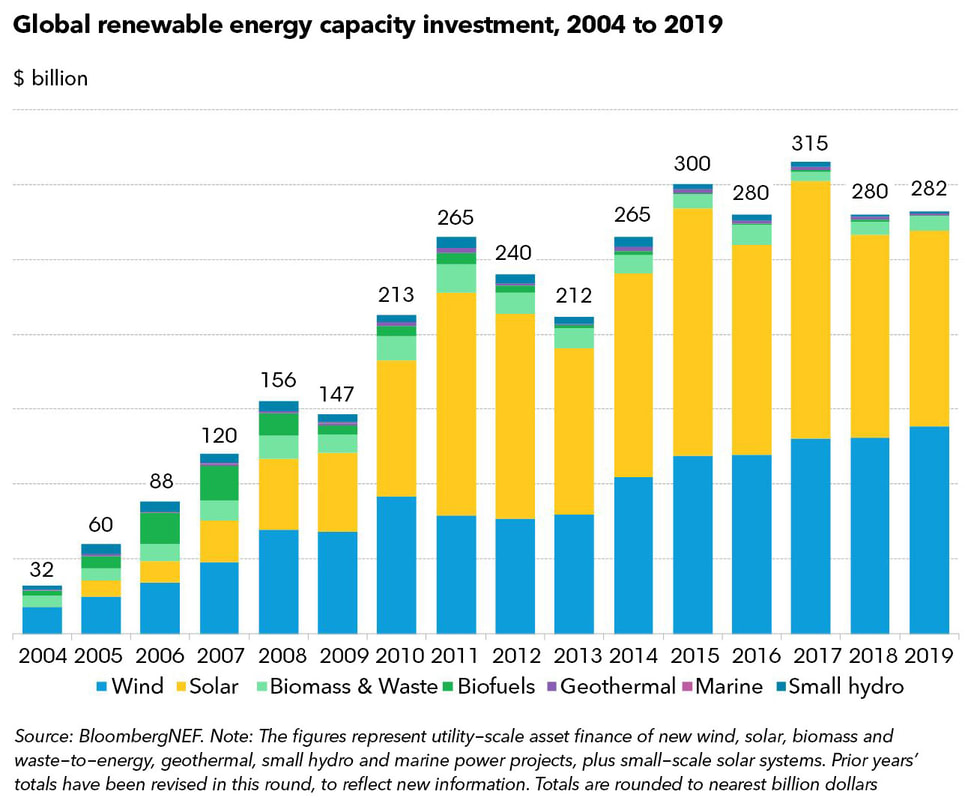 Bloomberg has published their data for renewable energy investment for 2019. This link is to an overview article. The graph above shows the overall 2019 renewable energy capacity investment and its history since 2004. 2019 ended up level with 2018 which extended the flat trend since 2011, to nine years. 2019 was initially looking to be a down year because of severe cutbacks in China, but it was rescued in Q4 by the US which saw a 28% gain over 2018 to a $55.5B total. This was driven by bringing forward projects to benefit from expiring subsidies. Next year will probably be a down year as subsidies decline. Investment in China, Europe, Japan, India and Australia all declined over 2018. While overall investment was flat, the capacity it purchased grew 20GW (12.5%) to 180GW as prices for wind and solar fell. The average $/W is now $1.57/W. In a normal market declining prices should see increasing spending. Prices have declined over 100% over the last nine years but spending has stayed flat. There is no shortage of demand for clean cheap electricity. The only explanation is that despite the amazing drop, prices are still too high and the only thing sustaining demand is still the need for subsidies. This is borne out by the observation that in every market across the world when subsidies are reduced the market shrinks. In 2019 this was obvious as China reduced subsidies and investment shrank. 2019 solar investment in China was one third of 2017 investment. The imminent expiry of US subsidies caused US investment to increase. Germany, once the premier investor in renewable energy now only invests a small fraction of past investment after subsidies were withdrawn. This is just further evidence that we are not on a path to reduce CO2 emissions with current renewable wind and solar energy. The issue is the price of electricity is too high. In addition, as I pointed out in previous posts, even as the cost of capacity falls, additional new costs necessary to grow intermittent capacity keep electricity prices increasing. The optimism driven from the ever decreasing cost of renewable energy capacity is understandable but it is not borne out by the evidence. For renewables to compete with fossil fuels prices have to fall considerably not just for generation but also for storage and transmission. Storage is not yet viable, never mind low cost and transmission costs are rising with NIMBY regulatory forces and the need to bury transmission lines. The expectation that we are on a path to 100% renewable energy is also clearly not borne out by the evidence of constantly increasing levels of atmospheric CO2. The graph below is the latest data for energy related Gigatons of CO2 emissions from the IEA. The overall trend is ever upward. Advanced economies are reducing emissions but the rest of the world is larger by far and increasing faster than the advanced economies are decreasing. 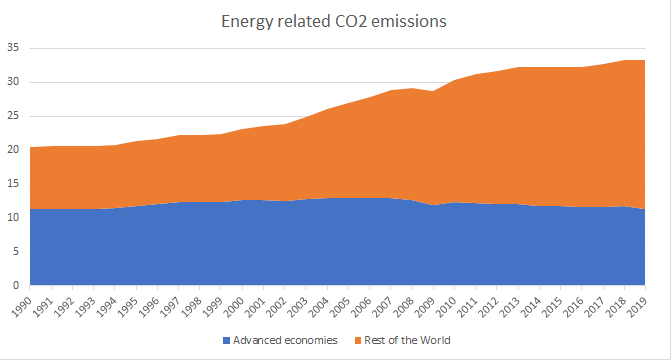 Stratosolar can make today's solar energy technology an economically viable replacement for fossil fuel generation for the rest of the world that cannot afford the expensive energy of advanced economies.
By Edmund Kelly |
Archives
December 2023
Categories
All
|
 RSS Feed
|
© 2024 StratoSolar Inc. All rights reserved.
|
Contact Us
|