
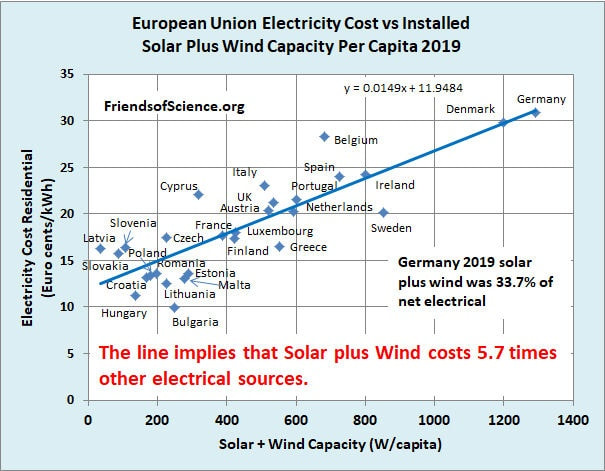
 This graph shows the price of electricity in 2019 across the EU. The vertical axis is price in cents/kWh. the horizontal axis shows installed wind and solar capacity in watts per person. As the installed capacity per person increases, the price increases. The value in this graph is the number of countries makes for a statistically large sample. This makes it harder to refute the reality that while wind and solar provide low cost electricity to grid operators, the additional costs of operating the grid with intermittent sources make electricity much more expensive to provide to consumers. In previous posts I have attributed the bulk of these additional costs to reduced overall grid capacity factor as the bulk of electricity costs are from capital costs.
Germany and Denmark have the highest installed wind and solar capacity and the highest priced electricity, at least 3X the countries with the lowest installed wind and solar capacity. As more capacity is added, additional investment in storage and transmission will add additional costs and instead of a straight line price will rise non linearly. These high prices are already causing pain but are sustainable because electricity only provides a fraction of total energy in rich countries. In a future where the bulk of energy will come from electricity the overall cost to consumers will increase significantly and will not be sustainable even in the richest countries and definitely not in the bulk of the developing world where most of the growth in energy is concentrated. By Edmund Kelly
Comments
|
Archives
December 2023
Categories
All
|
 RSS Feed
|
© 2024 StratoSolar Inc. All rights reserved.
|
Contact Us
|