StratoSolar
+1 408 821 7036
  • Home
  • Technology
    • Key Enabling Insights
    • PV Generation Platforms
    • Gravity Energy Storage
    • Communications Platform
    • Proven Technologies
    • Example Complete Energy Solution for the UK
    • Common Concerns >
      • Airspace
      • Hurricanes
      • FAQ
    • Gallery of Images >
      • Platform Shadow Videos
      • Japan Energy Solution Map
      • 2050 World Energy Sankey Diagram
      • 2050 Synthetic Fuel solution
      • 2050 Electricity solution
      • Climate Change Videos
  • Benefits
    • Low Cost Generation
    • Low Cost Energy Storage
    • Cost Reduction Roadmap
    • Sustainable and Scale-able
    • Zero Carbon
    • Energy Security
  • Contact Us
  • Blog
  • Login
    • Presentations
    • Gallery >
      • PV Documents >
        • PV Big Picture policy level document
        • PV California deployment
        • PV Japan deployment
        • PV UK deployment
        • Wind and Buoyancy Forces
  • Related Sites
  • Solve for x Videos

U.S. 2016 energy consumption visualized

4/20/2017

Comments

 
Picture
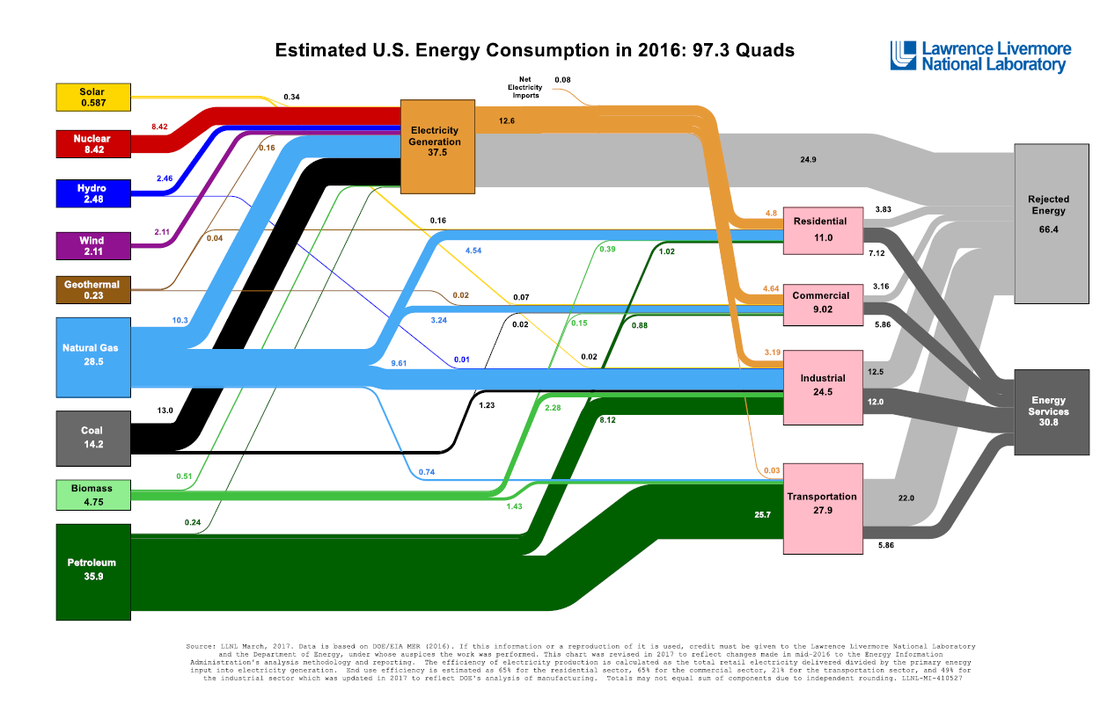
Lawrence Livermore National Laboratory have published a Sankey Diagram of US energy Consumption for many years. The most recent update shown above is for 2016. This shows the US energy flows in a quantitative manner using the width to show the size of each flow. The boxes are not scaled. To describe what this diagram shows in words would be very verbose and very difficult to understand. It captures a lot of data and presents it in a form that helps in understanding.  It shows the sources of energy on the left and the consumers of energy on the right. The extreme right shows the amount of consumption that does useful work and the amount that is rejected through inefficiency.

Even a quick perusal is very informative. The production side is dominated by fossil fuels. Natural gas is now twice as big as coal which has been the biggest change in recent years. The overall system is very inefficient with over two thirds of energy rejected. Electricity generation and transportation are the worst culprits. Solar is still tiny and wind is not much bigger.

This diagram only shows the US which is about 20% of world energy. On both a US and a world-wide basis more money is now invested in solar and wind generation than all the other sources of electricity generation combined. This shows that this investment is not supplying a noticeable amount of energy. The purpose of wind and solar is to eventually replace fossil fuels. This chart shows how far we are from achieving that goal.

World investment in wind and solar has been a constant $250B for the last five years, half the total investment in generation of about $500B. It is currently on a downswing, dropping 17% in Q1 2017. There is no indication of a likely increase in the near future. Wind and solar economics are steadily improving, but the rate is insufficient to make a dent in the problem they are meant to solve. The emperor has no clothes.

StratoSolar could make solar an effective solution that could realistically achieve a fossil fuel free energy system in a timeframe that can limit CO2 to 450 ppm.  Current solar will not succeed in a timely enough manner to limit CO2 to acceptable levels. The time for wishful thinking is past.
​
By Edmund Kelly
Comments
comments powered by Disqus

    Ed Kelly

    President of StratoSolar

    View my profile on LinkedIn

    Archives

    February 2023
    November 2022
    October 2022
    July 2022
    June 2022
    May 2022
    April 2022
    March 2022
    February 2022
    January 2022
    December 2021
    October 2021
    September 2021
    August 2021
    July 2021
    June 2021
    March 2021
    January 2021
    November 2020
    August 2020
    July 2020
    June 2020
    February 2020
    December 2019
    November 2019
    October 2019
    September 2019
    August 2019
    July 2019
    June 2019
    May 2019
    April 2019
    February 2019
    January 2019
    December 2018
    November 2018
    October 2018
    September 2018
    July 2018
    June 2018
    May 2018
    April 2018
    March 2018
    February 2018
    January 2018
    December 2017
    November 2017
    October 2017
    September 2017
    August 2017
    June 2017
    May 2017
    April 2017
    March 2017
    February 2017
    January 2017
    December 2016
    November 2016
    October 2016
    September 2016
    August 2016
    July 2016
    June 2016
    April 2016
    February 2016
    January 2016
    December 2015
    November 2015
    October 2015
    September 2015
    August 2015
    July 2015
    June 2015
    May 2015
    April 2015
    March 2015
    February 2015
    January 2015
    December 2014
    November 2014
    October 2014
    September 2014
    August 2014
    July 2014
    May 2014
    April 2014
    March 2014
    February 2014
    January 2014
    December 2013
    November 2013
    October 2013
    September 2013
    August 2013
    July 2013
    June 2013
    May 2013
    April 2013
    March 2013
    January 2013
    December 2012
    November 2012
    October 2012
    September 2012
    August 2012
    July 2012
    June 2012
    May 2012
    April 2012
    March 2012
    February 2012
    December 2011
    November 2011
    October 2011
    September 2011
    August 2011
    July 2011
    June 2011
    May 2011
    November 2010

    Categories

    All
    All Energy
    Alternative Energy
    Bill Gates
    China
    Clean Energy Investment
    Clean Energy Price
    Desalination
    Developing World
    Energy
    Energy-investment
    Energy Policy
    Germany
    Helium
    Japan Energy Pv
    Land Use
    O3b
    Pv
    PV Bubble
    Pv Subsidies
    Stratosolar
    Us Subsidies
    Wireless Communications

    RSS Feed

 © 2023 StratoSolar Inc. All rights reserved. ​618 S. 8th Street, Suite 400B, Richmond, CA 94804
Contact Us