
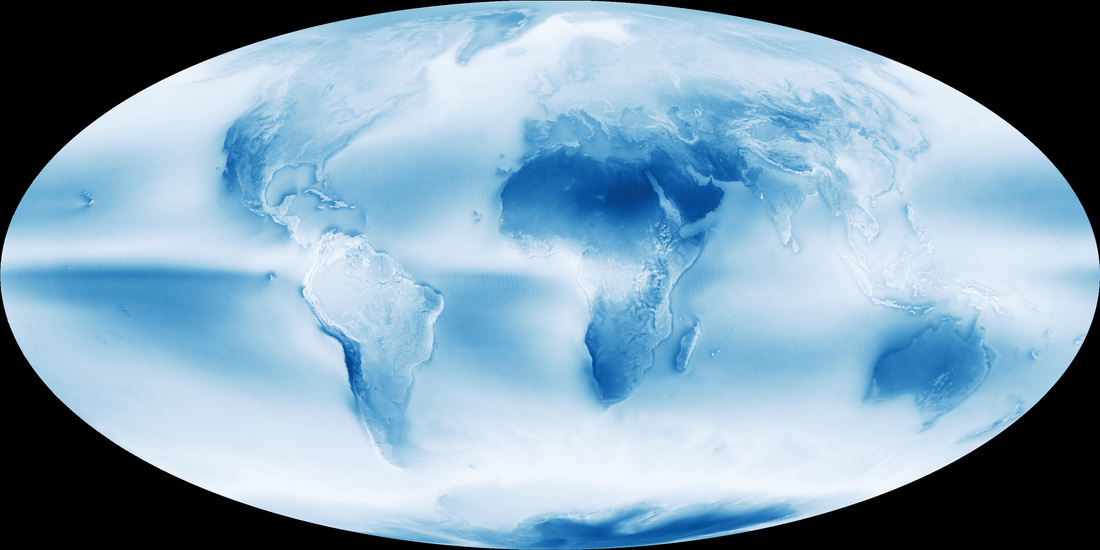
  Earth’s cloudy nature is unmistakable in this global cloud fraction map, based on data collected by the Moderate Resolution Imaging Spectroradiometer (MODIS) on the Aqua satellite. While MODIS collects enough data to make a new global map of cloudiness every day, this version of the map shows an average of all of the satellite’s cloud observations between July 2002 and April 2015. Colors range from dark blue (no clouds) to light blue (some clouds) to white (frequent clouds). This NASA site covers things in detail.
Part of the explanation for low ground level solar insolation levels is clouds blocking the sun. This picture from NASA, neatly illustrates the impact of clouds on solar insolation. Most of the world's population is in regions with heavy cloud cover. This includes Europe, China, Asia and North America. This picture also illustrates how truly exceptional California is. Clouds introduce two problems for PV generation. They reduce average insolation which reduces utilization, but perhaps more importantly, they can significantly reduce insolation over long periods lasting weeks. The only current solution to this problem is backup fossil fuel generation capacity of a similar magnitude to PV generation capacity. The developed world already has adequate fossil fuel generation capacity, so the impact is to reduce the utilization of fossil fuel power plants, which at low levels of PV generation is a low cost. However in the developing world, they are adding new generation capacity and so, adding PV in significant amounts will need new matching fossil fuel backup generation. StratoSolar, being above the clouds needs no fossil fuel backup generation, which with high PV market penetration will be a major advantage. However, this benefit is not yet in demand, so it seems StratoSolar suffers from premature timing. Markets don't anticipate. They respond. by Edmund Kelly
Comments
|
Archives
December 2023
Categories
All
|
 RSS Feed
|
© 2024 StratoSolar Inc. All rights reserved.
|
Contact Us
|