
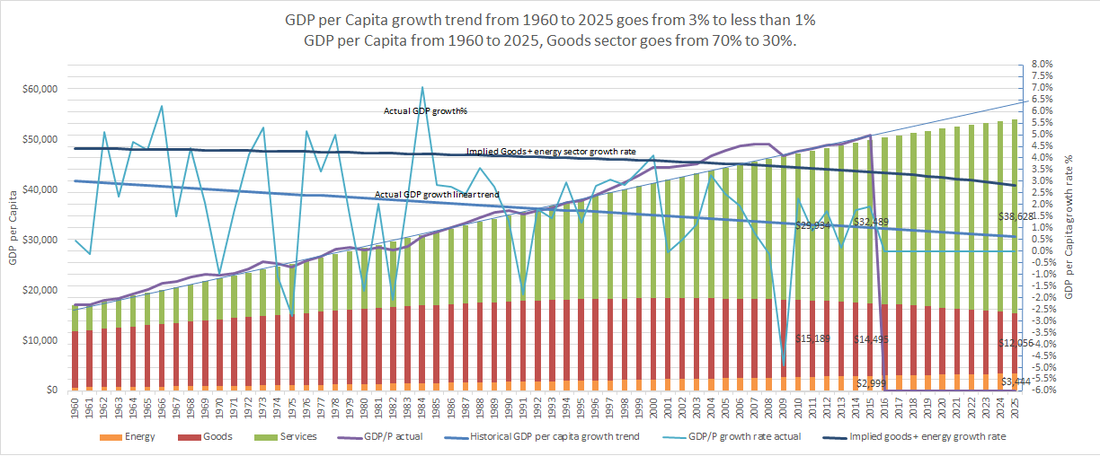
 This graph shows real US GDP per capita statistics from the period of 1960 to the present (54 years) with extrapolated trends to 2025. The data is from the US Bureau of Economic Analysis and the US Census Bureau. The chart also shows some simple modeled data based on the actual data. The modeled data is the stacked bar chart of GDP and the goods sector GDP growth rate trend line. This makes for a busy chart but puts all the data in one place to show how the model matches the real data. The jagged light blue line shows actual GDP growth per year (axis on the right). The heavy blue line shows the linear trend of this jagged growth % line. This shows a steadily declining growth rate trend line that starts at 3% in 1960 and is currently at 1% in 2015. Looking at more recent periods shows an increasingly larger rate of decline, so this is optimistic. The wavy purple line shows real GDP per capita (axis on the left). The stacked bars show a calculated GDP per capita generated only from the declining growth rate trend line and an initial 1960 GDP value. This accurately tracks actual GDP with small variations which validates the accuracy of the trend extracted from the very jagged GDP growth rate data. Periods where GDP is above and below the bars are periods with above and below the trend growth rate. The biggest up deviation is the decade preceding the financial collapse in 2008. This aligns well with the view that the 2008 collapse was caused by a debt fueled bubble that artificially temporarily maintained a higher growth rate. This declining GDP growth rate trend implies that we may no longer be at the comforting 2% longer term 115-year trend in economic growth that still seems to be the conventional wisdom of economists and politicians. This is no small matter. Modern prosperity since the industrial revolution is based on a growing economy based on increasing productivity that steadily produces more output per person. A rising tide that raises all boats. A falling tide is a good explanation for the stagnant wages and growing income inequality of recent decades, as decreasing gains are captured by minority segments of the economy. So, what explains this potentially disastrous decline in GDP growth rate? It could be assumed to be uniform across the whole economy with all sectors declining in productivity every year. This would imply some malaise that applied uniformly to the economy as a whole. However, we know that various sectors of the economy have different productivity growth rates, some improving, some declining or flat. 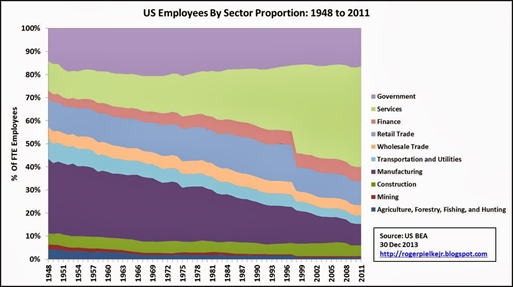 The graph above, again based on data from the Bureau of Economic Analysis and the Census Bureau, shows the proportion of employees in each economic sector from 1948 to 2011. This shows that manufacturing and goods producing sectors in the economy have roughly halved from 70% of employees to 35% of employees, while dramatically increasing the output of goods. This is the textbook definition of increasing productivity. It also shows that government has about the same 15% proportion of employees in 2011 as in 1948 for roughly the same government services, so there has probably been no overall productivity gain. The finance and services sectors have gone from 15% of employees in 1948 to 50% in 2011.
Given that we know the goods producing sector has maintained productivity, and the overall growth rate is declining, a simple first approximation would estimate no overall increase in growth rate for the finance and services sectors. This suggests a simple model that assumes the economy is divided into two broad sectors, a non productive sector NP that generates no GDP growth rate and a productive sector P that generates all GDP growth rate. This is probably an oversimplification, but the data shows it is very close to the truth. The stacked colored bars in the top graph represent GDP per capita (axis on the left) and illustrate two sectors P (productive) and NP (non productive) where GDP = P + NP. The red sector, P is set to 70% of GDP in 1960 and reduces to 35% of GDP in 2015. These numbers are chosen to approximately match the historical employment and gdp contribution of sectors in the economy shown in the employees by sector chart above. The following sectors are assumed to approximate a P sector: agriculture, mining, construction, manufacturing, transportation and utilities, wholesale trade and retail trade. Finance, services and government are the NP segment. This breakdown is oversimplified but broadly correct. These official statistics do not break out an energy sector. Energy is made up of pieces of other sectors mostly in the goods producing P segment. We know that energy consumption was around 8% of GDP in 2015. This means it was about 15% to 20% of the P sector. We know that energy’s contribution to GDP productivity growth as a sector is negative as it is taking more resources to produce the same energy over time. Using the historical decline in the overall rate of economic growth along with the historical reduction in the goods producing sector we can calculate a growth rate estimate for the P segment. This is shown with the purple line in the graph above. It starts at about 4.5% in 1960 and declines to about 3.5% in 2015. Given the increasing contribution of declining productivity energy sector to the goods producing P segment, it seems reasonable to infer that the energy sector is largely responsible for the 1% decline in P sector growth rate. The goods producing P sector is the engine of growth for the whole economy. The reduction in productivity of energy has a disproportionate affect on this engine of growth. To match the trend in overall growth rate decline, the graph shows that the decline in P sector growth rate is accelerating as energy becomes a larger fraction of the P sector. By 2025 if the current trend persists, the model shows that the non productive sector becomes 70% of the economy. The goods producing part of the economy is declining in absolute terms. The overall growth rate is well below 1%. This reduced rate of overall economic growth is already causing severe economic problems, contributing to income inequality and stagnant wages as the limited economic gains accrue to a powerful few. These problems will only get worse if the growth rate continues on its current downward trend. This illustrates that economic growth is a sensitive thing that cannot survive a large and growing part of the economy becoming less productive. This simple model shows that fixing the problem of lower growth means reducing the relative size of the non productive sectors. For the service sector problem areas, like finance, healthcare and education, the solutions are mainly political, but for energy the solution has to be mainly technological. By Edmund Kelly
Comments
|
Archives
December 2023
Categories
All
|
 RSS Feed
|
© 2024 StratoSolar Inc. All rights reserved.
|
Contact Us
|